OpenStreetMap logo OpenStreetMap

rtnf's Diary

Recent diary entries

Tag Review #1 : Cuisine

Posted by rtnf on 24 May 2024 in English.

The key cuisine=* is used to describe the type of food served at a place. The cuisine tag is used on amenity=restaurant, amenity=fast_food, or amenity=cafe to provide more information about the type of food served.

The value can describe the ethnic origin of the food, specific types of food featured, or other features about the food or style of food.

Ethnic Origin
chinese
italian
mexican
japanese
american
indian
asian
thai
french
greek
german
korean
tex-mex 
vietnamese
turkish
spanish
mediterranean
lebanese
georgian
indonesian
portuguese
filipino
african
polish
arab
malaysian
peruvian
caribbean
russian
brazilian 
british
bavarian
taiwanese
persian
middle_eastern
argentinian
balkan
moroccan
hawaiian
oriental
Specific Types of Food
pizza
burger
coffee_shop
sandwich
chicken
kebab
sushi
ice_cream
seafood
steak_house
fish_and_chips 
noodle
barbecue
bubble_tea
ramen
juice
donut
fish
friture 
crepe
beef_bowl
wings 
hot_dog 
tapas 
cake
bagel  
pasta
salad
frozen_yogurt
tacos
dumplings 
soba
grill 
curry
steak
tea
pretzel
coffee
pancake
shawarma
sausage
hotpot
Other Features About The Food or Style of Food.
heuriger 
diner 
buschenschank 
bistro 

breakfast
dessert

regional 
international 
local

Values can be combined using the semi-colon value separator. For example, cuisine=donut;coffee_shop denotes a place that specializes in both donuts and coffee, or cuisine=italian;pizza denotes an Italian restaurant that specializes in pizza.

donut;coffee_shop
ice_cream;burger
italian;pizza
sandwich;bakery
pizza;italian
kebab;pizza
breakfast;pancake
italian_pizza
pizza;kebab
western;japanese
japanese;sushi
noodle;ramen
pizza;regional
ice_cream;bubble_tea
pizza;burger
italian;regional
chicken;portuguese
coffee_shop;sandwich
regional;pizza
american;breakfast
burger;sandwich
american;steak
burger;pizza
burger;chicken
regional;italian
pizza;pasta
german;regional

The order is not important. (DUBIOUS : DISCUSS)

It is important to use existing values when possible to assist third party tools. However, other values may be used if they are meaningful. For example, if a restaurant specializes in a local dish, it is appropriate to tag that even if the tag does not have widespread global use.

Values should be all lower case, even when listing ethnicities or other proper nouns which would usually have the first letter capitalized. Values are usually singular (cuisine=burger not cuisine=burgers).

Notes
  1. All the quoted passages are taken directly from the OSM Wiki.
  2. All the examples above are taken from taginfo, sorted largest to smallest, with a minimum occurrence threshold of 602.
  3. Why 602 you ask? No particular reason at all. I just gave up summarizing everything from taginfo around that number.

On Toponyms

Posted by rtnf on 29 April 2024 in English.

One of the most rewarding aspects of being an OpenStreetMap contributor is the surprise of discovering where your contributions will be displayed next.

“I put that obscure, forgotten place back on the map, and now they’re everywhere!”


Researching toponyms is fun because I have to analyze the daily conversations among the locals and try to triangulate the place name centroid based on this conversations. Bonus point if my centroid triangulation somehow coincides with ancient, forgotten, historical maps.

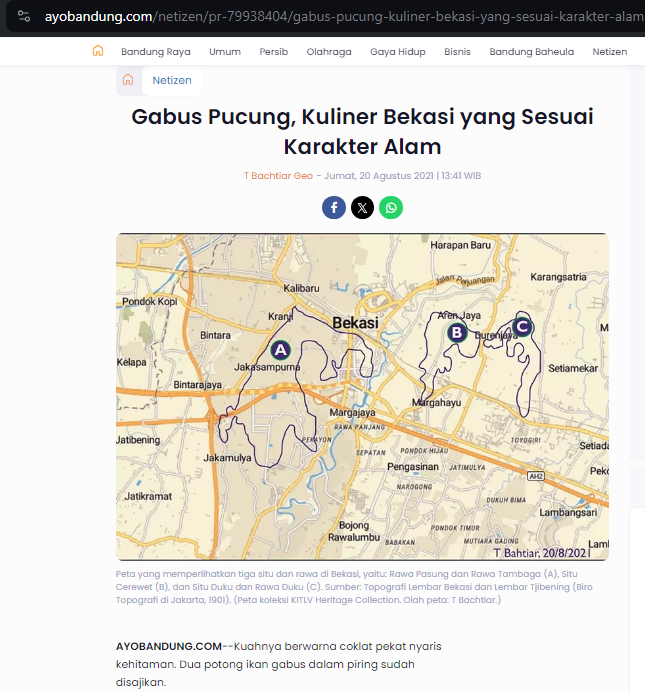
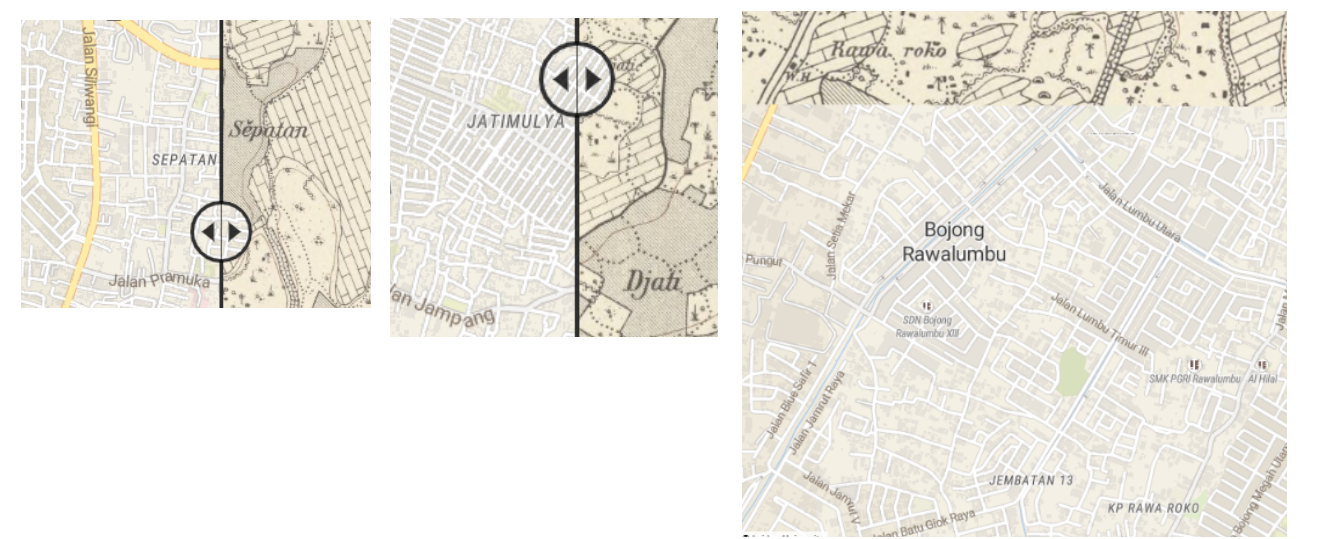
Traces of Sepatan, Djati, and Rawa Roko can still be found on old historical maps, circa 1900. Locals still use these toponyms right now, despite the government’s refusal to acknowledge their existence in the official addressing system.


It’s ‘forgotten’ in the sense that the local government over here has simplified the toponym system too much. Some toponyms have been upgraded to official administrative region names (and are now embedded in the official addressing system), while the rest have been left behind. People still use these ‘left-behind’ toponyms daily to refer to certain places, even though the government has somewhat ‘discouraged’ their use. (The colonial administration did it better, though. When I consulted the archives and library for old maps, all of these ‘left-behind’ toponyms were actually mapped quite well in the past.)

And this situation has led to mass confusion for people. Government-mandated addresses often don’t reflect reality. People still use all those ‘left-behind’ toponyms in their daily activities, yet they don’t appear on official, government-mandated maps and addressing systems.

That’s one of my personal missions right now: to put all those ‘left-behind’ toponyms back on the maps.

Location: Kp Rawa Roko, Babakan, Bekasi, West Java, Java, 17116, Indonesia

Weather Report and OpenStreetMap

Posted by rtnf on 6 March 2024 in English.

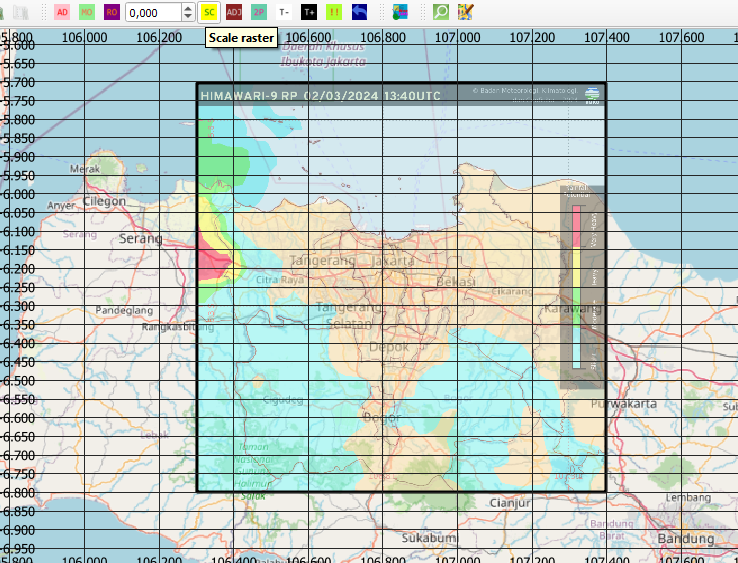
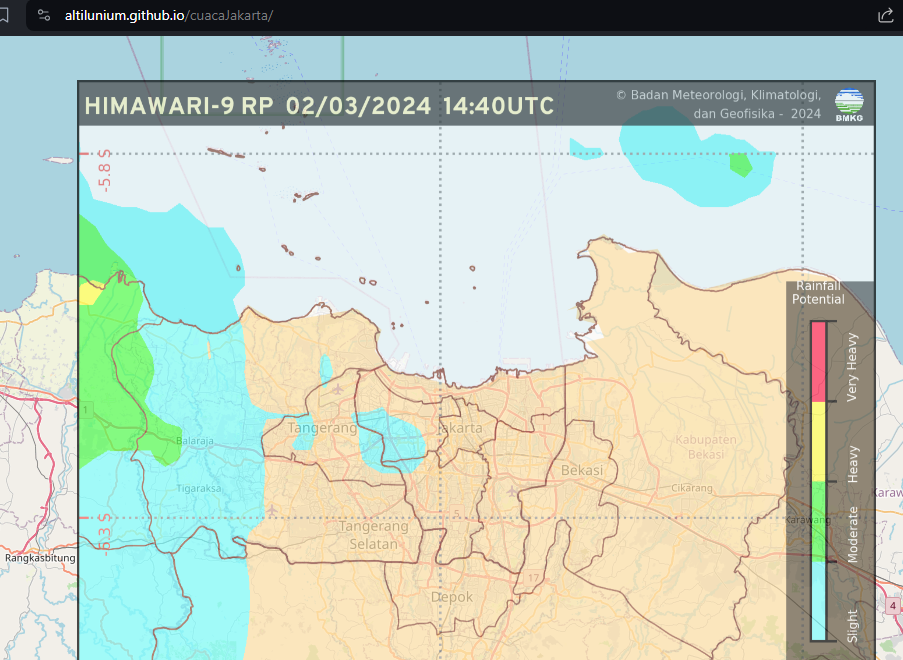
So, I stumbled upon this rain forecast map.

Cool. But I’m still not satisfied. I want to check the forecast situation around my house, specifically.

I have an idea. What if I overlay this image on OpenStreetMap?

Aligning

The first problem that I encountered is on how to properly align it with the OpenStreetMap map. Thankfully, this forecast map includes a coordinate grid.

So, I can show QGIS’s coordinate grid and align it properly.

I see -5.35 on the Y grid and 106.8 on the X grid, so I set a resolution of 0.05 on the Y-axis and 0.2 on the X-axis.

Next, I have to move and scale the image manually by using freehand raster georeferencer.

Stretching

Once it’s roughly aligned, the next thing I do is check the bottom-left coordinate of the image and the top-right coordinate of the image. Leaflet can “stretch” the image based on these two reference coordinate.

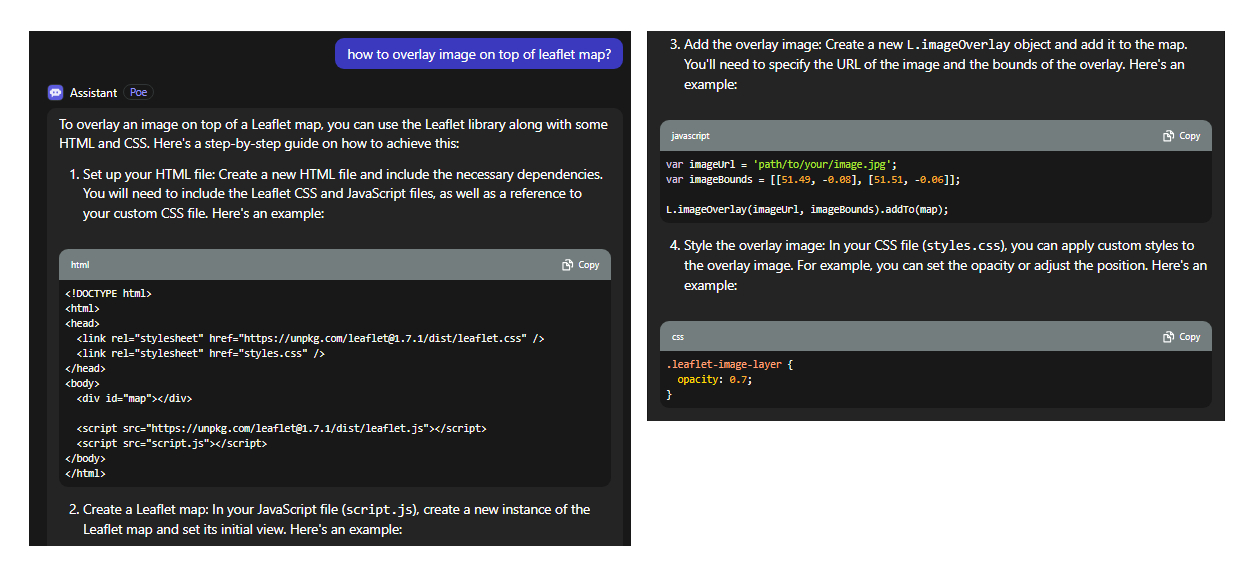
But anyway, now I need some code..

Thank you, Poe..

Done

And.. Finished..


But my adventure doesn’t end here…

The next day, after finishing this app, I attended a field event with my local community. To test the accuracy of this forecast system, I frequently used this app to predict whether the event location was going to rain or not. After conducting some direct observations, I came to a conclusion: there are other forecast models that are generally more accurate than this one. One of them is probably cmax(z).

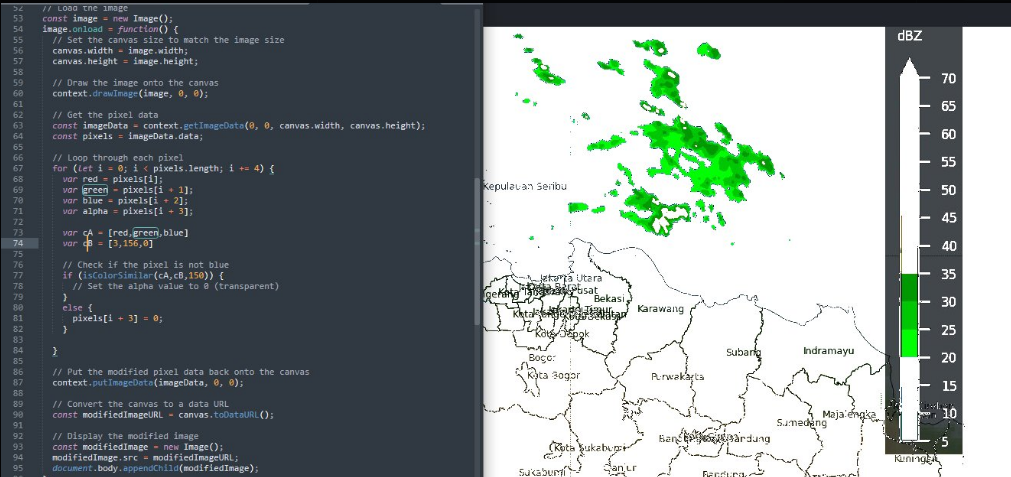
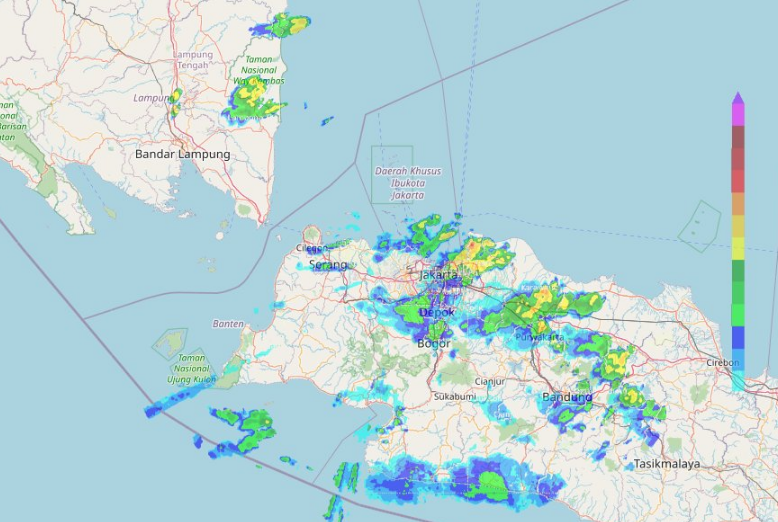
Well, i’m not really sure whether this is a “forecast model” to predict the future, or simply a “data model” to describe the current sky’s situation. I’m not a professional meteorologist, but I consulted with my meteorologist friend on X (formerly Twitter) about this. He said “cmax” means column maximum, the maximum rain intensity around an atmosphere’s vertical column, measured in dbZ unit. So, roughly, it describes the current situation: which place is raining right now, and how intense it is.

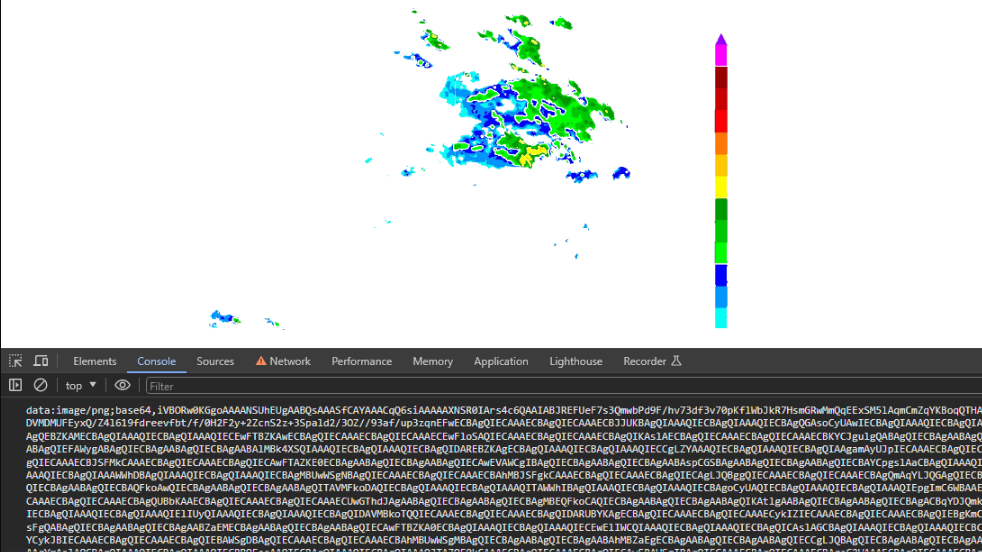
Alright. So, what’s next? Just do the exact procedure as before, but use a different image overlay? No, no, no. This one is different. Instead of simply overlaying the whole image, I have to manually “select” each color code and delete every other color that exists on the image.

Thankfully, we’re able to do pixel-by-pixel manipulation using the Canvas API.

And it’s done.

You can check the source code here.


Epilogue

Apparently, because I made too many requests to the weather station’s server, at some point, my IP address was blocked.

At first, I was planning to release this app publicly so that anyone could see the current weather conditions around a specific coordinate in real-time. But knowing that the weather station’s server is very sensitive to surges in traffic, I had to postpone this plan. The app was deployed to my own phone instead, and I used it for my personal use only.

Well, maybe I should talk to the weather station’s authorities before releasing this app publicly.

The OSM Iceberg : Personal Commentary

Posted by rtnf on 17 January 2024 in English.

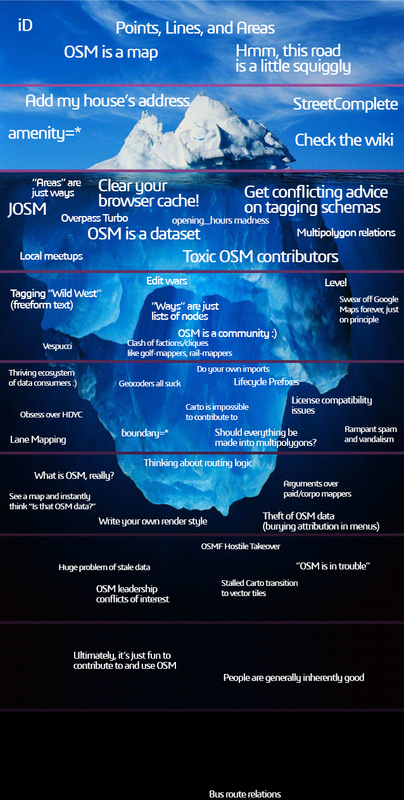
Inspired by Xvtn’s OSM Iceberg meme, I made my own personal recollections based on my own experiences.

Level 1

  • OSM is a map : Especially the default OSM Carto basemap that is used in various places outside of OpenStreetMap.org itself. Some people probably first encounter the name ‘OpenStreetMap’ through the attached attribution label on that basemap.
  • iD : The default web-based data editor on openstreetmap.org. The “hello world” of OpenStreetMap. Every OSM contributor (probably) starts here.
  • Points, Lines, and Areas : These are the things that you can add to OpenStreetMap.
  • Hmm, this road is a little squiggly : (Can’t relate. I rarely edit the road network on OSM.)

Level 2

  • Amenity=*: The first introduction to the intricacies of the OSM tagging scheme.
  • Check the wiki : More intricacies of the OSM tagging scheme.
  • StreetComplete : “Oh, so we can add data to OSM without using iD?”
  • Add my house’s address : (Can’t relate. I usually add significant POIs on OSM, not my own house.)

Level 3

  • Clear your browser caches! : Repeatedly press the Ctrl + F5 button to view the map update based on our recent OSM contribution. It’s truly satisfying to see the changes. (However, please note that some large area edits on a low zoom level might take more time.)
  • Opening_hours madness : Some OSM tagging schemes are quite… really difficult to understand.
  • Get conflicting advice on tagging schemas : Some OSM tagging schemes are quite… inconsistent.
  • “Areas” are just ways : The first introduction to the OSM data model. It’s actually “nodes, ways and relations”, not “points, lines and areas”.
  • Multipolygon relations : OSM relations are hard.
  • JOSM : The OpenStreetMap editor for power users.
  • Overpass Turbo : Search for specific OSM data and download it.
  • OSM is a dataset : After realizing the truth about the OSM data model, its tagging intricacies, its variety of third-party editing tools, and the fact that we can “download the data back” by using Overpass, OSM is not merely a “map” anymore. Yes. Now, OSM is a dataset.
  • Local meetups : Get in touch with the community.
  • Toxic OSM contributors : Get in touch with the community (went wrong).

Level 4

  • Tagging “Wild West” (freeform text) : Some OSM tagging schemes are quite… anarchy.
  • Clash of factions/cliques like golf-mappers, rail-mappers : Some OSM tagging schemes are quite… political.
  • Level : (Surprisingly, I don’t know anything about this. I know about layer though.)
  • Edit wars : Get in touch with the community (went really wrong).
  • “Ways” are just lists of nodes : Slow realization about the truth behind the OSM data model. (And yes, relations are just ordered lists of nodes/ways/relations)
  • Swear off Google Maps forever, just on principle : (Yes. But in my case, it’s probably just a phase.)
  • Vespucci : The OpenStreetMap editor for power users (on mobile!).
  • OSM is a community :) : A map? A dataset? No! OSM is a community :)

Level 5

  • Thriving ecosystem of data consumers : A slow realization about the existence of third-party OSM data consumers, which makes our OSM edits visible in unexpected places. Random maps on web/apps sometimes show data that we added to OSM, and it can be surprising and exciting.
  • Do your own imports : (Can’t relate, I’m actually scared to do my own data imports because I don’t want to risk damaging the OSM database with a poorly executed import.)
  • License compatibility issues : (Can’t relate, did I already tell you that I rarely perform data imports myself?)
  • boundary=*: (Can’t relate. In my case, only official government organizations have access to boundary data. I rarely import data from them.)
  • Should everything be made into multipolygons? : (Can’t relate, I usually map simple things and don’t encounter the need to create multipolygons often.)
  • Geocoders all suck : (Can’t relate, I rarely use OSM-based geocoders.)
  • Rampant spam and vandalism : (Slightly can’t relate. I usually map simple things and then just move on. I don’t actively defend my past contributions anymore. I did have a negative experience with an edit war in the past, which made me give up on it.)
  • Lane Mapping : (I don’t know about it at all.. Did I already tell you that I rarely edit road network?)
  • Lifecycle prefixes : (I am aware of the existence of lifecycle prefixes, but I have never used them before.)
  • Carto is impossible to contribute to : (Can’t relate. I have never attempted to contribute to Carto.)

Level 6

  • Thinking about routing logic : (Can’t relate. I rarely edit the road network.)
  • See a map and instantly think “is that OSM data?” : Yes, whenever I see a basemap, the first thing I do is check if a specific toponym or obscure POI that I added myself is present on that map….
  • Theft of OSM data (burying attribution in menus) : …. Once I confirm that my OSM contribution exists on a map, the next thing I check is whether the proper OSM attribution is displayed. If the attribution is not shown or is hidden in menus, i’m slightly mad.
  • Write your own render style : I have tried to write my own render style in the past but quickly gave up. That painful experience made me appreciate OSM Carto even more.
  • Arguments over paid/corpo mappers : (Can’t relate. While I’m aware of the existence of corporate mappers, I don’t have any strong opinions to share.)
  • What is OSM, really? : Is it a map? A dataset? A community? A trademark that encompasses an entire ecosystem consisting of the dataset, the tagging scheme, the rendering infrastructure, and the subculture around its mappers, developer-mappers, and third-party data consumers?? What is OSM, really?

Level 7

  • OSM leadership conflicts of interest : I have heard about this issue in the news, but I don’t fully understand its implications. However, it does make me somewhat concerned.
  • OSMF Hostile Takeover : I have heard about this issue in the news as well, but I don’t fully understand its implications. It does make me somewhat uneasy.
  • “OSM is in trouble”: There are many doomsday theories about how the OSM project will soon meet its demise. It does make me somewhat scared.
  • Huge problem of stale-data : (I haven’t heard of this issue before.)
  • Stalled Carto transition to vector tiles : I have heard about this issue in the news, but personally, I remain hopeful and patiently await its resolution.

Level 8

  • People are generally inherently good : Instead of dwelling on the imminent doomsday scenarios for OSM, it’s important to recognize that our OSM community is filled with many good-hearted individuals!
  • Ultimately, it’s just fun to contribute and use OSM : Instead of getting overly caught up in the technical intricacies and concerns about OSM, it’s important to remember that contributing to and using OSM can be a source of joy. So, go outside, experience the world, add missing POIs, and be happy!

Level 9

  • Bus route relations : (Can’t relate. The public transportation system in my neighborhood is barely functional, and there is no need for me to extensively map it on OSM.)

OpenStreetMap + Wikidata

Posted by rtnf on 10 January 2024 in English.

So, one day, I stumbled across US State Boundary QA Checks, a web app utility for identifying issues with boundary relations in the US by utilizing both OSM and Wikidata. This app queries both Wikidata (via SPARQL Query Service) and OpenStreetMap data (via Overpass API) by using simple Javascript.

For a long time, I’ve been quite interested in the concept of “integrating both Wikidata and OpenStreetMap data, then using the coalesced data for domain-specific purposes,” but I have never done it before. Perhaps I can learn something from this source code on how to query both of them and merge the data (by using Javascript).

Here’s what I found.

Querying Overpass
function stringifyParams(params) {
    return Object.keys(params)
        .map(key => `${encodeURIComponent(key)}=${encodeURIComponent(params[key])}`)
        .join('&');
}

var overpassUrl = 'http://overpass-api.de/api/interpreter'
var relationID = 2388361 + 3600000000;
var query2 = `[timeout:180][out:csv(::id,wikidata,wikipedia,admin_level,boundary,name,"name:en";true;',')];
        area(id:${relationID})->.a;
        (
          rel[boundary=administrative][admin_level~"^7|8|9$"](area.a);
        );
        out;`;
var xhr2 = new XMLHttpRequest();
xhr2.open('POST', overpassUrl, true);

xhr2.onreadystatechange = function () {
           if (xhr2.readyState === 4) { // Check if the request is complete
               if (xhr2.status === 200) { // Check if the request was successful
                   console.log('Response:', xhr2.responseText);
               } else {
                   console.error('Error:', xhr2.status, xhr2.statusText);
               }
           }
       };

xhr2.send(stringifyParams({data:query2}))

Note :

  • Overpass Area ID is OpenStreetMap Relation Id + 3600000000
Querying Wikidata
var query = `SELECT ?item ?itemLabel WHERE 
{
  ?item wdt:P31 wd:Q146. 
  SERVICE wikibase:label { bd:serviceParam wikibase:language "en". } 
}`;
var abc = encodeURIComponent(query)
var uri = "https://query.wikidata.org/sparql?format=json&query=" + abc
var xhr = new XMLHttpRequest();
xhr.onreadystatechange = function() {
    if (xhr.readyState == 4 && xhr.status == 200) {
        var data = JSON.parse(xhr.responseText);
        console.log(data);
    }
    else{
        console.log("error")
    }
};
xhr.send();

Well, currently, I don’t have any project ideas regarding OSM + Wikidata integration. But I’ll definitely save these code blocks for future reference, just in case I need them someday.

Expanding Bisangkot to Malaysia

Posted by rtnf on 20 December 2023 in English.

Inspired by this talk, I aim to expand the coverage of this OSM-public-transportation-route-viewer to include Malaysia.

To begin, I extracted this list from routes.tracestrack.com, comprising 236 bus route relations in Malaysia (last data update: 30 Oct 2023). My objective is to obtain the OSM ID for each route listed. Therefore, I copied all the data (Ctrl+A, Ctrl+V) into a plaintext file, saved it, and processed it with this simple Python script.

def process_line(line):
    if "iDJOSM" in line:
        print(line.split(" ")[0], end=",")
    
def process_file(file_path):
    try:
        with open(file_path, 'r') as file:
            for line in file:
                process_line(line)
    except FileNotFoundError:
        print("File not found:", file_path)
    except Exception as e:
        print("An error occurred:", str(e))

if __name__ == "__main__":
    file_path = 'my.txt'
    process_file(file_path)

Subsequently, I used this list of OSM route IDs to download all the routes using JOSM. File -> Download object… -> Object type: relation -> Download relation members -> Download object.

After waiting for the download to complete, I saved the download data as an OSM file.

Following this, I used this script to preprocess all the downloaded routes, converting the OSM file to a GeoJSON file.

Finally, I embedded the resulting GeoJSON file into a leaflet viewer. And it’s done.

See the result here : https://altilunium.github.io/bisangkot/my.html

And here is the tabular view : https://github.com/altilunium/bisangkot/wiki/v23.12.20

Election Day

Posted by rtnf on 2 December 2023 in English.

Today, I received an email regarding the Foundation Board election. It’s finally time to vote. So, I read all the board candidates’ manifestos and Q&A session answers before finally deciding on whom to vote for.

While reading those materials, I came across several interesting quotes along the way. Take a look :

My long-term vision for OpenStreetMap is it becoming the default map because it has eclipsed its competitors in accuracy, completeness, actuality and detail.

The ideal state of OpenStreetMap is trivially a state where everyone knows that the project exists. The threshold to contribute shall be so low that everyone can record or update any map feature they consider notable.

First of all, I would like to thank all DWG members for the enormous amount of work they have to do to ensure that our work is not destroyed. If elected to the board, I will try to ensure that part of the OSMF funds are allocated to solutions that facilitate the work of DWG colleagues as well as to support them in recruiting new volunteers.

The recent cases of vandalism in Ukraine and Israel have undermined trust in our data; some data consumers have stopped updating their maps there. Investing in advanced tools to aid the Data Working Group is imperative for enhancing prevention, detection, and reversion of vandalism.

The board should consult the community on what to do for large anonymous donations if we have that luxury problem in the future. I am strongly against strings attached to any donations. The only ones we have ever accepted was the promise that we would earmark the donated funds for the fundraised purpose.

Our greatest strength is our community of editors, and as long as we are united, the project will not be at risk.

We shall start to attract the next generation. The existing generation of mappers have been intrinsically motivated by the absence of useable map data before OpenStreetMap came to frution. Now, good map data is a commodity, and we need to retell the story to remind people that there is hard and ongoing work behind the data.

Strengthening local chapters is vital, not just for diversity but to encourage local initiatives that improve quality.

We should explore support for temporary data like festivals or roadworks and maybe even real-time data integration. This could significantly enhance the utility and relevance of our maps.

2024 promises to be an exciting year with the launch of our new vector tiles. These will be open-schema, minutely updated, and designed for easy remixing with personal or open datasets.

Active mappers around us

Posted by rtnf on 20 November 2023 in English.

One day, I read a passage in a newspaper.

“The president directly observed the construction of earthquake-resistant houses in Sirnagalih Village, Cilaku Subdistrict, Cianjur Regency.”

Now, I’m just curious. How is the situation regarding the completion of OpenStreetMap data around that village? Who is the most active mapper around that area?


First, find the exact coordinates of Sirnagalih Village. Search for it on OpenStreetMap, zoom in enough, right-click, and then click ‘show address.’ The coordinates will be displayed.

Next, we need to convert these coordinates into a ‘bounding box’ format. I have created a simple Python script to convert coordinates into a bounding box (with a specified radius_km).

from geopy.distance import geodesic

def calculate_bounding_box(input_coordinate, radius_km):
    # Convert input coordinate to (latitude, longitude) format
    input_lat, input_lon = map(float, input_coordinate.split(','))

    # Calculate bounding box coordinates
    bounding_box = (
        input_lon - (radius_km / 111.32),  # left
        input_lat - (radius_km / 111.32),  # bottom
        input_lon + (radius_km / 111.32),  # right
        input_lat + (radius_km / 111.32)   # top
    )

    return bounding_box

# Example usage:
input_coordinate = "-6.855560091864419, 107.12470041831004"  # Replace with your input coordinate
radius_km = 1

result = calculate_bounding_box(input_coordinate, radius_km)
count = 0
bbox_str = ""
bbox_view = "https://altilunium.github.io/bbox/?bbox=" 
bbox_api ="https://api.openstreetmap.org/api/0.6/map?bbox="
for i in result:
    
    count = count + 1
    if count == 4:
        print(i)
        bbox_str = bbox_str + str(i)
    else:
        print(i,end=",")
        bbox_str = bbox_str + str(i) +","
print()
print("See bbox visualization : ")
print(bbox_view+bbox_str)
print()
print("Download OSM data : ")
print(bbox_api+bbox_str)

Input the coordinates, run the Python program, and you will receive the bounding box coordinates. In my case, the bounding box coordinates are “106.76161822320681,-6.645804632233569,106.77958444670664,-6.627838408733748”.

Next, use the OSM API to retrieve all the data around that bounding box.

Simply access https://api.openstreetmap.org/api/0.6/map?bbox=106.76161822320681,-6.645804632233569,106.77958444670664,-6.627838408733748 directly in your browser, but make sure to change the “bbox=” parameter to your bounding box coordinates first. Then, an XML file named “map.osm” will be downloaded.

Finally, use this script to process the downloaded OSM file.

import xml.etree.ElementTree as ET
import sys

sys.stdout = open(sys.stdout.fileno(), mode='w', encoding='utf-8', buffering=1)

dictuser = dict()
currentUser = ""

def iterate_osm_objects(osm_file_path):
    try:
        tree = ET.parse(osm_file_path)
        root = tree.getroot()

        # Iterate through all elements in the OSM file
        for element in root.iter():
            # Process each element as needed
            for i in element.attrib:
                if i == "user":
                    currentUser = element.attrib[i]
                    if element.attrib[i] not in dictuser:
                        dictuser[element.attrib[i]] = dict()
                        dictuser[element.attrib[i]]['count'] = 1
                        dictuser[element.attrib[i]]['bagtags'] = dict()
                    else:
                        dictuser[element.attrib[i]]['count'] = dictuser[element.attrib[i]]['count'] + 1
            for j in element:
                if j.tag == "tag":
                    kstring = j.attrib["k"]+"="+j.attrib["v"]
                    #print(j.attrib["k"]+"="+j.attrib["v"])
                    if kstring not in dictuser[currentUser]['bagtags']:
                        dictuser[currentUser]['bagtags'][kstring] = 1
                    else:
                        dictuser[currentUser]['bagtags'][kstring] = dictuser[currentUser]['bagtags'][kstring] + 1

    except ET.ParseError as e:
        print(f"Error parsing the OSM file: {e}")
    except Exception as ex:
        print(f"An error occurred: {ex}")

# Example usage:
osm_file_path = "sirnagalih.xml"  # Replace with the actual path to your OSM XML file
iterate_osm_objects(osm_file_path)

sorted_dict = dict(sorted(dictuser.items(), key=lambda item: item[1]['count'], reverse=True))

for i in sorted_dict:
    print (i,dictuser[i]['count'])
    sorted_dict2 = dict(sorted(dictuser[i]['bagtags'].items(), key=lambda item: item[1], reverse=True))
    for i in sorted_dict2:
        print("["+str(sorted_dict2[i])+"] "+str(i))
    print()

You’ll see the report regarding the most active users around that area, sorted by edit count and their frequently used tags. Something like this :

Dyah Wuri 9950
[2520] building=yes
[3] natural=wood
[2] leisure=sports_centre
[1] landuse=farmland
[1] highway=construction

Alex Rollin 4460
[365] building=yes
[50] natural=tree
[14] natural=water
[13] bicycle=designated
[13] foot=designated
[13] highway=path
[13] segregated=no
[9] natural=wood
[9] building=house
[4] highway=residential
[4] water=pond
[4] highway=pedestrian
[3] landuse=farmland
[3] service=driveway
[3] surface=cobblestone
[2] incline=10°
[2] surface=paving_stones
[2] width=2.5
[2] landuse=grass
[2] leisure=pitch
[2] landuse=cemetery
[1] amenity=toilets
[1] access=private
[1] leisure=swimming_pool
...

Streets and its administrative boundaries

Posted by rtnf on 11 October 2023 in English. Last updated on 12 October 2023.

Task : Get all streets within an administrative boundary. Then for each street, specify all administrative sub-boundaries that it crosses.


First, download all the boundaries and the streets by using JOSM.

[out:xml][timeout:90];
area(3607626001)->.searchArea;
(
  way["highway"](area.searchArea);
  relation["type"="boundary"]["admin_level"="6"](area.searchArea);
  relation["type"="boundary"]["admin_level"="7"](area.searchArea);
  relation["type"="boundary"]["admin_level"="9"](area.searchArea);
);
(._;>;);
out meta;

Note : “7626001” is the target administrative regional boundary’s relation ID. Add this number with 3600000000 in order to get the 3607626001.

Save that downloaded OSM data as GeoJSON format.

Next, process that GeoJSON format with python script. Coalesce all the hierarchical sub-boundaries into a flat single layer boundary.

In this case, we will convert "kecamatan" -> "kelurahan" -> "rw" boundary to "kecamatan" -> "kecamatan:kelurahan" -> "kecamatan:kelurahan:rw" boundary, then we keep the most bottom one ("kecamatan:kelurahan:rw")

import json
from shapely.geometry import Polygon
import sys

def array_of_arrays_to_tuples(array_of_arrays):
    array_of_tuples = []
    for coordinate_array in array_of_arrays:
        if len(coordinate_array) == 2:
            coordinate_tuple = tuple(coordinate_array)
            array_of_tuples.append(coordinate_tuple)
    return array_of_tuples

def is_polygon_inside(polygon1_coords, polygon2_coords):
    # Create Shapely Polygon objects from the input coordinates
    polygon1 = Polygon(polygon1_coords)
    polygon2 = Polygon(polygon2_coords)
    return polygon1.within(polygon2)


file_path = 'jakartabarat.geojson'

with open(file_path, 'r', encoding='utf-8') as geojson_file:
    data = json.load(geojson_file)
    features = data['features']
    
    kecamatan = []
    kelurahan = []
    rw = []

    for feature in features:
        try:
            if feature['properties']['type'] == "boundary" and feature['properties']['admin_level'] == "6" :
                kecamatan.append(feature)
            if feature['properties']['type'] == "boundary" and feature['properties']['admin_level'] == "7" :
                kelurahan.append(feature)
            if feature['properties']['type'] == "boundary" and feature['properties']['admin_level'] == "9" :
                rw.append(feature)
        except Exception:
            pass


    for i in kelurahan:
        for j in kecamatan:
            poly_lurah = array_of_arrays_to_tuples(i['geometry']['coordinates'][0][0])
            poly_camat = array_of_arrays_to_tuples(j['geometry']['coordinates'][0][0])
            if is_polygon_inside(poly_lurah,poly_camat):
                i['properties']['name'] =  j['properties']['name'] +" - "+ i['properties']['name']
                
    for i in kelurahan:
        print(i['properties']['name'])

    for i in rw:
        for j in kelurahan:
            poly_rw = array_of_arrays_to_tuples(i['geometry']['coordinates'][0][0])
            poly_lurah = array_of_arrays_to_tuples(j['geometry']['coordinates'][0][0])
            if is_polygon_inside(poly_rw,poly_lurah):
                i['properties']['name'] =  j['properties']['name'] +" - "+ i['properties']['name']

    for i in rw:
        print(i['properties']['name'])

    with open("rwrw", 'w') as json_file:
        json.dump(rw, json_file)

Finally, for each street that we have, check whether that street is crossing or within that coalesced administrative boundary.

import json
from shapely.geometry import LineString,Polygon
import sys

def array_of_arrays_to_tuples(array_of_arrays):
    array_of_tuples = []
    for coordinate_array in array_of_arrays:
        if len(coordinate_array) == 2:
            coordinate_tuple = tuple(coordinate_array)
            array_of_tuples.append(coordinate_tuple)
    return array_of_tuples

def is_polygon_inside(polygon1_coords, polygon2_coords):
    polygon1 = Polygon(polygon1_coords)
    polygon2 = Polygon(polygon2_coords)
    return polygon1.within(polygon2)

def isJalandiRW(p1,p2):
    pp1 = LineString(p1)
    pp2 = Polygon(p2)
    return pp1.crosses(pp2) or pp1.within(pp2)

file_path = 'jakartabarat.geojson'
with open(file_path, 'r', encoding='utf-8') as geojson_file:
    data_ori = json.load(geojson_file)

file_path = 'rwrw'
with open(file_path, 'r', encoding='utf-8') as geojson_file:
    rw = json.load(geojson_file)
    for i in rw:
        print(i['properties']['name'])

jalan = []
features = data_ori['features']
for feature in features:
    try:
        if len(feature['properties']['highway']) > 0 :
            print(feature['properties']['name'])
            jalan.append(feature)
    except Exception:
        pass

for i in jalan:
    for j in rw:
        try:
            poly_jalan = array_of_arrays_to_tuples(i['geometry']['coordinates'])
            poly_rw = array_of_arrays_to_tuples(j['geometry']['coordinates'][0][0])
            if isJalandiRW(poly_jalan,poly_rw) :
                print(i['properties']['name'] + " --> " + j['properties']['name'] )
        except Exception:
            pass

Here’s the result : https://gist.github.com/altilunium/72d679c65ee4635c445fd3757e312923


Note #1 The source code mentioned in this post only work on JOSM-made geojson export. It doesnt work on Overpass-Turbo-made geojson export. The reason is, to represent an administrative boundaries, JOSM uses multipolygon while Overpass Turbo uses polygon.

Note #2 Special thanks to my pair programming partner.

Popular tags around us

Posted by rtnf on 24 June 2023 in English. Last updated on 26 June 2023.

Problem : I want to know about popular POI tags around my area.


First, download the whole OSM data around your target area by using JOSM. Exclude all the road-related tag by using “-(highway=*)” query wizard.

File -> Save As -> .osm file. Then process this osm file by using the following python script.

from lxml import etree

ddict = dict()
with open("your-osm-file.osm", encoding="utf-8") as fp:
    tree = etree.parse(fp)
    root = tree.getroot()
    for i in root:
        for j in i:
            try:
                mstring = j.attrib["k"] +":"+ j.attrib["v"]
                if mstring not in ddict:
                    ddict[mstring] = 1
                else:
                    ddict[mstring] = ddict[mstring] + 1
            except:
                pass
    sorted_ddict = {k: v for k, v in sorted(ddict.items(),key=lambda item:item[1],reverse=True)}
    for j in sorted_ddict:
        print(j,"[",sorted_ddict[j],"]")

Note : change mstring = j.attrib["k"] +":"+ j.attrib["v"] to mstring = j.attrib["k"] if you want to generate per-key statistics.

Here is the final result (raw):

Here is the processed result, the most popular POI tags around my hometown :

  • amenity:place_of_worship [ 131 ]
  • amenity:school [ 114 ]
  • building:school [ 109 ]
  • amenity:restaurant [ 65 ]
  • shop:convenience [ 55 ]
  • building:mosque [ 51 ]
  • leisure:park [ 49 ]
  • building:hospital [ 48 ]
  • amenity:fuel [ 43 ]
  • leisure:pitch [ 39 ]
  • office:government [ 37 ]
  • amenity:clinic [ 34 ]
  • amenity:bank [ 32 ]
  • leisure:garden [ 32 ]
  • place:neighbourhood [ 30 ]
  • amenity:hospital [ 29 ]
  • place:village [ 28 ]
  • atm:yes [ 27 ]
  • shop:mall [ 26 ]
  • amenity:fast_food [ 26 ]
  • shop:supermarket [ 24 ]
  • healthcare:clinic [ 21 ]
  • shop:general [ 21 ]
  • place:suburb [ 19 ]
  • amenity:pharmacy [ 19 ]
  • amenity:marketplace [ 18 ]
  • healthcare:hospital [ 18 ]
  • amenity:cafe [ 17 ]
  • shop:hardware [ 16 ]
  • public_transport:station [ 14 ]
  • leisure:swimming_pool [ 12 ]
  • amenity:police [ 11 ]
  • tourism:hotel [ 10 ]
  • amenity:atm [ 10 ]
  • shop:mobile_phone [ 9 ]
  • leisure:sports_centre [ 9 ]
  • shop:garden_centre [ 9 ]
  • amenity:kindergarten [ 8 ]
  • shop:bakery [ 8 ]
  • amenity:food_court [ 7 ]
  • craft:carpenter [ 7 ]
  • shop:motorcycle [ 6 ]
  • shop:clothes [ 6 ]
  • amenity:community_centre [ 5 ]
  • tourism:guest_house [ 5 ]
  • office:company [ 5 ]
  • shop:car_repair [ 5 ]
  • amenity:library [ 5 ]
  • shop:computer [ 4 ]
  • shop:greengrocer [ 4 ]
  • shop:stationery [ 4 ]
  • shop:motorcycle_repair [ 4 ]
  • amenity:townhall [ 4 ]
  • shop:car [ 4 ]
  • amenity:post_office [ 3 ]
  • shop:electronics [ 3 ]
  • amenity:car_wash [ 3 ]
  • shop:hairdresser [ 3 ]
  • shop:furniture [ 3 ]
  • shop:laundry [ 3 ]
  • amenity:recycling [ 2 ]
  • historic:monument [ 2 ]
  • leisure:water_park [ 2 ]
  • shop:toys [ 2 ]
  • shop:tailor [ 2 ]
  • healthcare:pharmacy [ 2 ]
  • shop:perfumery [ 2 ]
  • shop:optician [ 2 ]
  • leisure:fishing [ 2 ]
  • shop:bicycle [ 2 ]
  • shop:sewing [ 2 ]

Analyzing OSM's Tile Logs

Posted by rtnf on 2 June 2023 in English.

So, I stumbled across this logs (https://planet.openstreetmap.org/tile_logs/)

Let’s (mass) download it, starting from June 26, 2022 until today.

Here’s the content of each csv files : domain name, unknown number, and another unknown number.

Then, process all those downloaded files. Let’s merge all the statistics for each domain name into one single JSON file.

Finally, let’s sort all those domain name based on their occurrences.

Here’s the final result (https://gist.github.com/altilunium/1dd0a8de3852a27fc025bd3a5f07e5ed) :

“341” means that this domain exists in at least 341 OSM’s daily log tile files, from June 6, 2022, until today (June 2, 2023).


Update :

Here’s the same statistics, but for apps (https://gist.github.com/altilunium/7d0b02cb3a248b4c457f3ac31731217c)

Finally, filter that statistics, only for Indonesian apps :

  • Government ministry and agency
    • kemdikbud.go.id : The Ministry of Education, Culture, Research, and Technology
    • atrbpn.go.id : Ministry of Agrarian Affairs and Spatial Planning
    • bmkg.go.id : Meteorology, Climatology, and Geophysical Agency
    • kemenkopukm.go.id : Ministry of Cooperatives & Small and Medium Enterprises
    • kemendagri.go.id : Ministry of Home Affairs
    • esdm.go.id : Ministry of Energy and Mineral Resources
    • pu.go.id : Ministry of Public Works and Public Housing
    • bkkbn.go.id : National Population and Family Planning Board
    • dephub.go.id : Ministry of Transportation
  • Local Government
    • bandung.go.id : Bandung (City)
    • banjarkab.go.id : Banjar (Regency)
    • ntbprov.go.id : West Nusa Tenggara (Province)
    • jabarprov.go.id : West Java (Province)
    • makassarkota.go.id : Makassar (City)
    • tenggulangbaru.id : Tenggulang Baru (Village)
    • palembang.go.id : Palembang (City)
    • kotabogor.go.id : Bogor (City)
    • banjarbarukota.go.id : Banjarbaru (City)
    • malangkota.go.id : Malang (City)
  • Company
    • telkom.co.id : State-owned telecommunication company
    • pertamina.com : State-owned oil and gas company
    • gps.id : GPS tracker company
    • wahana.com : Delivery services company
  • Subsystems
    • com.atlas.eturjawali.dirty : e-Turjawali, Indonesian Traffic Police’s management & monitoring system
    • ppdb-disdikgarut.id : School Admission System - Garut
    • ppdbpekanbaru.id : School Admission System - Pekanbaru
    • sikadirklhk.id : Sistem Rekam Kehadiran ASN Terintegrasi (SIKADIR) - Attendance Recording System - Ministry of Environment and Forestry
    • cctv.malangkota.go.id : Public CCTV - Malang
    • bhumi.atrbpn.go.id : Cadastral Maps - Ministry of Agrarian Affairs and Spatial Planning
    • sekolah.data.kemdikbud.go.id : National School Database - The Ministry of Education, Culture, Research, and Technology
    • juanda.jatim.bmkg.go.id : Weather Stations - Meteorology, Climatology, and Geophysical Agency
    • com.telkomsel.telkomselcm : MyTelkomsel, mobile network operator app.
    • com.bkppdklaten.saenaga/ : Sistem Informasi Presensi Elektronik Abdi Satya Nagara (Saenaga) - Klaten Regency (Attendance Recording System)
    • absensi.estamina : Endless Sistem Manajemen Kinerja Aparatur (e-STAMINA) - Probolinggo Regency (Attendance Recording System)
    • prasasti.mojokerto : Presensi ASN Berbasis Teknologi Informasi (PRASASTI) - Mojokerto Regency (Attendance Recording System)
    • absensi.jemberbaru : Layanan Pegawai Elektronik (LPE) - Jember Regency (Attendance Recording System)
    • sipreti.malangkota.com : Sistem Informasi Presensi Terkini (SIPRETI) - Malang City (Attendance Recording System)
    • kmob.jabarprov.go.id : Kinerja Mobile - West Java Province (Attendance Recording System)

So, I want to contribute a public transportation route that I know to OSM. It’s a little bit hard, but it’s completely doable by using JOSM. Done.

Next? I want to see all the available bus route that already exist on OSM.

So, I made this : altilunium.github.io/bisangkot

It’s pretty much straightforward. Download the route by using Overpass API, convert the downloaded OSM data into the geojson format, display it by using leaflet, then add a little interactivity control, such as “hover to display the route’s name” and “click to focus the route”.

For this one, I queried the Java island only. You can query other region by using this script. Just change the bbox settings on line 32. Then, convert the downloaded OSM data into the geojson format by using this python script that I made.

The conversion is pretty much straightforward, except this “jitter” function.

You know, a single road may contain several route. This condition could confuse Leaflet js, causing the misfirings of onClick and onMouseover event. So, to fix this problem, I try to separate each route as a single geojson line. Every route that crosses a same road will be moved slightly to random direction and random distance from the original coordinate. This simple trick somewhat solved the problem quite well.

Okary. Now, what next? Maybe, encourage more people to add new public transportation route data, I think. Improve both the data quality and quantity. Or perhaps, let’s make a route finder apps (how to reach point A to point B by using public transportation).

Self-hosted vector tiles.

Posted by rtnf on 26 January 2023 in English.

Inspired by this video, i want to make my own self-hosted vector tiles.

First, prepare several geojson file by using JOSM. Each geojson file will serve as a “layer”. We can specify the style for each layer. I made three layer (mainroad, suburb, jalan_rest), with this specification

  • mainroad : highway= (secondary | primary | trunk | tertiary)
  • suburb : place=suburb
  • jalan_rest : highway= (* && not secondary && not primary && not trunk && not tertiary)

Use JOSM, create overpass query, save as .geojson, repeat.

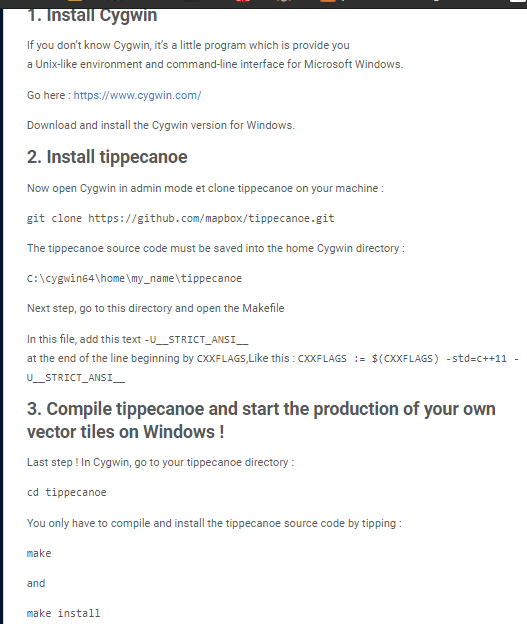
Second, convert these geojson file to mbtile format by using tippecanoe. Installing tippecanoe on MacOS / Linux is pretty straightforward. But, installing on Windows needs a quick-hack. I followed this guide , it works.

Then combine all those geojson file into one mbtile file by using tippecanoe.

Then, convert that mbtile file to pmtile by using go-pmtiles

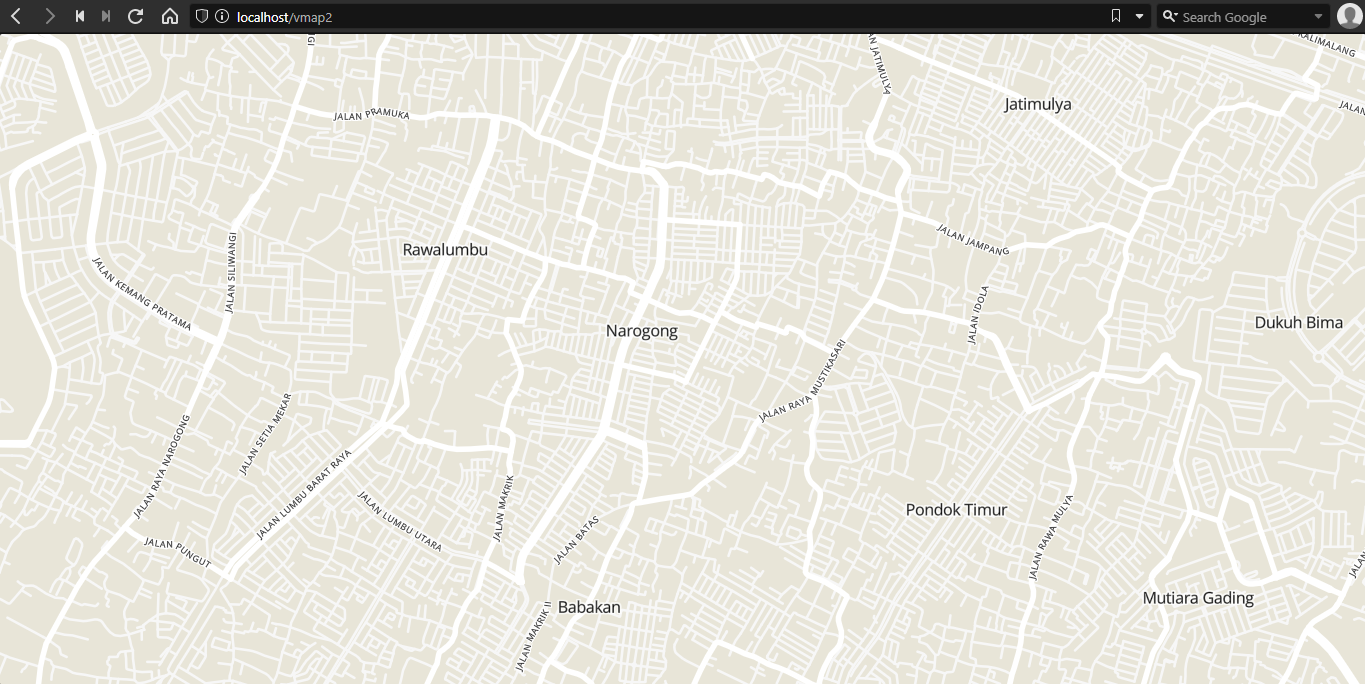
Now, let’s display that mbtile and do some styling.

Index.html, first, let’s import maplibre-gl and pmtiles javascript library.

<script src='maplibre-gl.js'></script>
<link href='maplibre-gl.css' rel='stylesheet' />
<script src="pmtiles-2.5.0.js"></script>

Then, define the map

let protocol = new pmtiles.Protocol();
        maplibregl.addProtocol("pmtiles",protocol.tile);
        console.log(maplibregl)
        var map = new maplibregl.Map({
            container: 'map',
            style: 'styles/maptiler-basic.json',
            center: [106.99811303126697,-6.295502009348816],
            zoom: 11
        });

The rest of the configurations are stored on that “maptiler-basic.json”.

Let’s configure the pmtiles file

"sources": {
    "openmaptiles": {
      "type": "vector",
      "url": "pmtiles://bks2.pmtiles"
    }
  }

Then, configure the fonts file

 "glyphs": "fonts-gh-pages/{fontstack}/{range}.pbf"

Finally, configure the actual map style. Match the “layer” from tippecanoe’s output to “source-layer” tag.

Mainroad layer style :

{
      "id": "road_major_motorway",
      "type": "line",
      "source": "openmaptiles",
      "source-layer": "mainroad",
      "layout": {"line-cap": "round", "line-join": "round"},
      "paint": {
        "line-color": "hsl(0, 0%, 100%)",
        "line-offset": 0,
        "line-width": {"base": 1.4, "stops": [[8, 1], [16, 10]]}
      }
    }

Suburb layer style

{
      "id": "place_label_city",
      "type": "symbol",
      "source": "openmaptiles",
      "source-layer": "suburb",
      "maxzoom": 16,
      "layout": {
        "text-field": "{name}",
        "text-font": ["Open Sans Regular"],
        "text-max-width": 10,
        "text-size": {"stops": [[3, 12], [8, 16]]}
      },
      "paint": {
        "text-color": "hsl(0, 0%, 0%)",
        "text-halo-blur": 0,
        "text-halo-color": "hsla(0, 0%, 100%, 0.75)",
        "text-halo-width": 2
      }
    }

Jalan-rest layer style

{
      "id": "road_minor",
      "type": "line",
      "source": "openmaptiles",
      "source-layer": "jalan_rest",
      "minzoom": 13,
      "layout": {"line-cap": "round", "line-join": "round"},
      "paint": {
        "line-color": "hsl(0, 0%, 97%)",
        "line-width": {"base": 1.55, "stops": [[4, 0.25], [20, 30]]}
      }
    }

Road label configuration

 {
      "id": "road_major_label",
      "type": "symbol",
      "source": "openmaptiles",
      "source-layer": "mainroad",
      "minzoom": 13,
      "layout": {
        "symbol-placement": "line",
        "text-field": "{name}",
        "text-font": ["Open Sans Regular"],
        "text-letter-spacing": 0.1,
        "text-rotation-alignment": "map",
        "text-size": {"base": 1.4, "stops": [[10, 8], [20, 14]]},
        "text-transform": "uppercase",
        "visibility": "visible"
      },
      "paint": {
        "text-color": "#000",
        "text-halo-color": "hsl(0, 0%, 100%)",
        "text-halo-width": 2
      }
    },
    {
      "id": "road_minor_label",
      "type": "symbol",
      "source": "openmaptiles",
      "source-layer": "jalan_rest",
      "minzoom": 13,
      "layout": {
        "symbol-placement": "line",
        "text-field": "{name}",
        "text-font": ["Open Sans Regular"],
        "text-letter-spacing": 0.1,
        "text-rotation-alignment": "map",
        "text-size": {"base": 1.4, "stops": [[10, 8], [20, 14]]},
        "text-transform": "uppercase",
        "visibility": "visible"
      },
      "paint": {
        "text-color": "#000",
        "text-halo-color": "hsl(0, 0%, 100%)",
        "text-halo-width": 2
      }
    }

Done!

OSMSG : A security concerns

Posted by rtnf on 21 January 2023 in English.

So, I just stumbled across this tool, “OpenStreetMap Stats Generator”.

This python tool can automatically download and process current planet file and generate the statistics. Cool.

osmsg [-h] [--start_date START_DATE] [--end_date END_DATE] --username USERNAME --password PASSWORD
             [--timezone {Nepal,UTC}] [--name NAME] [--tags TAGS [TAGS ...]] [--rows ROWS] --url URL [--extract_last_week]
             [--extract_last_day] [--extract_last_month] [--extract_last_year] [--exclude_date_in_name]
             [--format {csv,json,excel,image,text} [{csv,json,excel,image,text} ...]] [--read_from_metadata READ_FROM_METADATA]

But I have some concerns.

Why it needs my OSM username and password? Can I trust this tool? What if this tool store my OSM credentials on 3rd party database or something? Not to mention that, we have to type our password manually in the console, in visible plain text (which is, could be stored too on console’s history).

So I decided to dig the source code to find some clue.

def auth(username, password):
    print("Authenticating...")
    try:
        cookies = verify_me_osm(username, password)
    except Exception as ex:
        raise ValueError("OSM Authentication Failed")

    print("Authenticated !")
    return cookies

Alright, now where the cookies go?

if "geofabrik" in args.url:
        cookies = auth(args.username, args.password)
if "geofabrik" in url:
            cookies_fmt = {}
            test = cookies.split("=")
            # name, value = line.strip().split("=")
            cookies_fmt[test[0]] = f'{test[1]}=="'
            response = requests.get(url, cookies=cookies_fmt)
        else:
            response = requests.get(url)

Okay, Geofabric. Does Geofabric really need our OSM credentials or something?

I found some clue here ;

Files which are accessible on our public download server without any login do not contain sensitive data about the OpenStreetMap contributors. The user, uid and changeset fields are missing in these files since May 3, 2018. You can download files with full metadata from a different download server which requires log-in with your OpenStreetMap account. Files from the this non-public download server contain data which is subject to EU data protection regulations. These regulations apply world-wide.

In short, not all Geofabrik planet files require an OSM credential. If we don’t give our OSM credentials, we still can download planet files without personal data of the OSM contributors. But somehow, this python tool forces us to give our OSM credential whenever a geofabrik url is supplied.

Meanwhile, Geofabrik itself provides a safe and proper way to transfer our OSM authorization to 3rd party. That is : (1) redirect to the official openstreetmap.org page, (2) click “grant access”, (3) redirected back to 3rd party page. This way, 3rd party tool don’t know (and don’t store) our valued OSM username and password.

In short, this python tool might risk your OSM account because it doesn’t implement a security best practices to transfer OSM authorization to 3rd party. Even if this tool doesn’t actually store your OSM password (we might need more investigation regarding this accusation), your password is still visible and recorded to your own console history, in plaintext format.

osmimgur : See tagged imgur images on OSM

Posted by rtnf on 19 January 2023 in English. Last updated on 20 January 2023.

First, download all OSM objects that contain the substring “imgur” inside the “image:” tag. I use Overpass API on JOSM.

[out:xml][timeout:90];
(
  nwr[~"image"~"https://i.imgur.*"];
);
(._;>;);
out meta;

Then, export the downloaded OSM objects as GeoJSON file for further processing.

Next, for the sake of simplicity, filter everything except OSM point node. Also trim all of the OSM tag except the image to minimize the GeoJSON filesize.

import json
f = open('imgur.json',encoding='utf-8')
data = json.load(f)
allobj = data['features']
newdata = {}
newdata['type'] = "FeatureCollection"
newdata['generator'] = "rtnf"
newdata['features'] = []

for i in allobj:
	if i['geometry']['type'] == "Point":
		prop = i['properties']
		for j in prop:
			if "image" in j:
				#print(prop[j])
				newy = {}
				newy['type'] = "Feature"
				newy['properties'] = {}
				newy['properties']['image'] = prop[j]
				newy['geometry'] = i['geometry']
				newdata['features'].append(newy)
print(json.dumps(newdata))

Finally, show this preprocessed geojson file by using Leaflet frontend. Since the dataset is quite massive, use MarkerCluster plugin. I tried it before without this plugin, and my browser was crashed.

var map = L.map('mapid',{ preferCanvas:true, zoomControl: false }).setView({lat: -6.2, lng:  107.0},1)

// Basemap
L.tileLayer(
  'https://tile.tracestrack.com/_/{z}/{x}/{y}.png', {
    maxZoom: 18,
    attribution: 'Data: © <a href="https://www.openstreetmap.org/copyright">OpenStreetMap contributors</a>
  }).addTo(map);

// Marker cluster
var markers = L.markerClusterGroup();
markers.addLayer(L.geoJSON(a, {
    onEachFeature: onEachFeature
}));
map.addLayer(markers)

// Pop-up on click
function onEachFeature(feature, layer) {
    if (feature.properties && feature.properties.image) {
        layer.bindPopup("<img src='"+feature.properties.image+"'><br><a target='_blank' href='"+feature.properties.image+"'>Image license</a>");
    }
}

Installing MapLibre GS Native on Android

Posted by rtnf on 7 January 2023 in English. Last updated on 16 January 2023.

Back then, my laptop was a potato, so i can’t afford to run Android Studio decently. That’s why i never touched Android Development at all back then.

But now, I got core i5 + SSD. Let’s try Android Development once again, all from scratch.

Download and install :

  • Download android-studio-2021.3.1.17-windows.exe (912.92 MB)
  • Install. But it downloads several additional packages. Wait, then finished.
  • Open. Create new project. But it downloads, yet again, several additional packages. Wait, then it finally finished. In the end, my Android Studio downloaded additional 2.1 GB data.

Now, for starter, let’s make a map app by using MapLibre GL Native.

Why MapLibre? I stumbled across “Overpass Ultra” , a fork of OverpassTurbo that claimed better performance than OverpassTurbo since it used “MapLibre GL” (GPU-accelerated vector rendering library) instead of Leaflet (which is used by Overpass Turbo). I simply want to test their claim.


Okay, let’s read the installation guide on MapLibre’s github page.

First, let’s add Maven Central repository. It’s a “central server” that stores libraries, packages, and everything else. Just like Python’s “pip” or Linux’s “apt” or Node’s “npm”, it’s a convenient public service to make developer life’s way much better.

Open “Gradle Scripts -> build.gradle (Project : )”. Here’s what I got after opening that file :

plugins {
    id 'com.android.application' version '7.3.1' apply false
    id 'com.android.library' version '7.3.1' apply false
    id 'org.jetbrains.kotlin.android' version '1.7.20' apply false
}

Now, let’s modify it like this :

plugins {
    id 'com.android.application' version '7.3.1' apply false
    id 'com.android.library' version '7.3.1' apply false
    id 'org.jetbrains.kotlin.android' version '1.7.20' apply false
}
allprojects {
    repositories {
        mavenCentral()
        gradlePluginPortal()
        google()
    }
}

While MapGL Native is located at mavenCentral, I added additional gradlePluginPortal (for Gradle-related dependencies) and google (for any official google dependencies).

Then, let’s sync. But unfortunately, it failed. “Build was configured to prefer settings repositories over project repositories”. Oh no.

Let’s copy-and-paste this error message right to Google Search. Suddenly, it solved! Many thanks to YCuiCui’s answer on StackOverflow. All I had to do is just open the settings.gradle, and delete the whole dependencyResolutionManagement block.


Alright, by the way, what is a “Gradle” anyway?

Put it simply, it’s a build tool. Back then, compiling an app solely by using command-line hackery was really tedious and hard. Something something like javac ClassName.java -> java ClassName. The complexities are increased exponentially if our apps consisted of tons of source code files. By using build tool, everything can be easier, in the automated way.

Hans Dockter created Gradle in 2008. Then in 2013, Google selected Gradle as default build tool for Android. Here’s an excerpt of his interview regarding the history of gradle :

As I started using Groovy as a technology for my initial build system, I thought it would be good idea to attend the first ever Groovy and Grails Exchange. There I met Steven Devijer, the co-founder of Grails, who was also doing some work on an internal build tool for his client. We both got very excited about pushing a new build system forward.

Gradle was, always has been, and always will be our idea for a more efficient continuous delivery tool.

Google’s involvement with the new Gradle-based Android build system was a dramatic accelerant for the community. We’ve made more progress in the last year than I anticipated we’d make in five.

We decided to use Groovy as the language of build.gradle files. But 90% of Gradle is written in Java.


Okay, let’s back to installing MapLibre. After we registered the repository’s location (mavenCentral, Gradle and Google), we should register the MapLibre library itself. Let’s open Gradle Scripts -> build.gradle (Module: ) , and add this line inside the dependencies bracket.

dependencies {
        ...
        implementation 'org.maplibre.gl:android-sdk:<version>'
        ...
    }

Umm. Well.. Version? What version? MapLibre’s official documentation on Github doesn’t say anything about which version is it. Aaa. Help.

At first, I guessed that it’s probably android-sdk version. I see the build.gradle (module) file, and there’re several sdk versions over there. Compile sdk (32), min sdk (21) and target sdk (32). I tried all of them, but i failed.

Then, I guessed once more. It’s probably maplibre’s version right? Now where i can see the latest maplibre’s version? I can’t see it on MapLibre’s github page. Now, let’s see in Maven Central website. Search “maplibre”. Got it! “org.maplibre.gl:android-sdk:9.6.0” (latest version). So, it’s 9.6.0 afterall.

I put “9.6.0” on that placeholder, and finally it works. Sync success

To be continued on the next part

Who is the first OSM editor around my city?

Posted by rtnf on 30 November 2022 in English.

While editing this week’s edition of WeeklyOSM, I discovered that OSHDB version 1.0 has been released. So, I decided to test it by myself.

Set the bbox around Bekasi, Indonesia. Then set the filter to (key=highway, value=blank).

Then, I see the download button. Apparently, we can download the detailed CSV data.

So, it seems that the first highway edit happened around August 12, 2008.

Now I’m really curious, who is this OSM editor that contributed to the first highway ever around my city?


After digging the API documentation, I found a solution.

Step 1 : Get the data

Run this python script. It will generate a json file.

import requests
URL = 'https://api.ohsome.org/v1/elementsFullHistory/geometry'
data = {"bboxes": "106.9216919,-6.4162955,107.1153259,-6.0982253", "time": "2008-01-01,2016-01-01", "filter": "highway=*"}
response = requests.post(URL, data=data)
print(response.text)

Note : It’s hard to manually construct the bbox. So, i use the JOSM editor to calculate the bbox for me.

Step 2 : Process the data

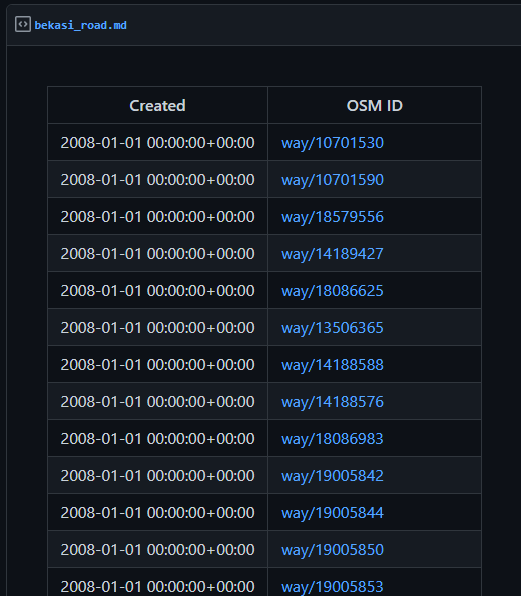
This code will sort the retrieved OSM objects (that json file from step 1) according to their creation date. Then it will output a nice markdown table, with links to OSMLab’s OSM Deep History, for further inspection.

import json
from datetime import datetime
from dateutil.parser import parse

f = open('bekasi.json')
data = json.load(f)
allobj = []

for i in data['features']:
	obj = {}
	fromT = parse(i['properties']['@validFrom'])
	obj['from'] = fromT
	obj['id'] = i['properties']['@osmId']
	allobj.append(obj)

allobj = sorted(allobj, key=lambda d: d['from'])
print("Created | OSM ID")
print("-|-")
for i in allobj:
	oid = str(i['id'])
	print(str(i['from'])+ " | "+"["+oid+"](https://osmlab.github.io/osm-deep-history/#/"+oid+")")

Here’s the result :

Minor Revision

Then I suddenly realized that, why I start the query from “2008-01-01”? Can we go even further? What happens if I set the start date to 2000, for example?

{
  "timestamp" : "2022-11-30T06:03:43.184642",
  "status" : 404,
  "message" : "The given time parameter is not completely within the timeframe (2007-10-08T00:00:00Z to 2022-11-20T21:00Z) of the underlying osh-data.",
  "requestUrl" : "https://api.ohsome.org/v1/elementsFullHistory/geometry"
}

Apparently, 2007-10-08 is the maximum limit. So, I recalculated the data, based around this limit. Here’s the revision.


So, what is the first OSM highway edit around my city? I still don’t know. This statistics showed that OSM edit has already begun since 2005, but this API’s maximum limit is around 2007.

JOSM : Update Java

Posted by rtnf on 11 November 2022 in English. Last updated on 14 November 2022.

You are running version 1.8.0_351 of Java. JOSM will soon stop working this version. We highly recommend you to update to Java 17.0.5 Would you like to update now?

Whoa. Scary.

I immediately opened my Java updater, update the java, then relaunch the JOSM.

But it’s failed. The message is still shown. What’s wrong?

Then I clicked the “update Java” button on the JOSM’s warning message. But I got redirected to definitely-not-Java website.

Whoa. What’s wrong?


Well, actually I already know the context behind all of this. Due to recent Java’s license change, JOSM might be incompatible to the official Java release. That’s why JOSM redirected me to Azul Open JDK instead of the official Java site.

Still, it’s quite confusing, even for me who understand the context.


Okay, now I downloaded Azul Open JDK. Extracted it. But unfortunately, there is no installer at all. Uargh. Another headache.

Okay, so I got java.exe inside “bin” folder. So I just have to run the josm-tested.jar against this brand new java.exe. That means I’m gonna need some command prompt hackery here and there.

Create a new shortcut, “type the new location of the item”, then :

%comspec% /k C:\Users\LENOVO\Downloads\zulu17.38.21-ca-fx-jre17.0.5-win_x64\bin\java.exe -jar C:\Users\LENOVO\Downloads\zulu17.38.21-ca-fx-jre17.0.5-win_x64\bin\josm-tested.jar

Finally I got a working JOSM windows shortcut. No more nagging “pls update” warning notification. Yey!


Update from the comment section : There’s actually a (windows) installer. Choose “msi” instead of “zip” on the download page.

TIGER, OSM US & MapRoulette

Posted by rtnf on 6 September 2022 in English.

TIGER

The US Census Bureau’s Topologically Integrated Geographic Encoding and Referencing (TIGER) system. The Census Bureau maintains the TIGER database to assist in its various mandated programs, including the decennial US Census. Because the TIGER database is built with public funding, it is by law in the public domain. TIGER contains the locations of nearly every street, highway, railroad, body of water and legal boundary in the US. It is built from a combination of original US Geological Survey and Census Bureau maps, updated with data collected by Census Bureau staff while in the field.

Bulk Import

“I noticed that someone is importing TIGER line data. Should I keep making changes to the map or should I wait for the TIGER data to show up?”

“The reality is that people have been told for years not to map too much in the US because the TIGER upload will obviate the need for your work. That has kept mappers away.”

The TIGER data has long been a tempting target for OSM. Being in the public domain, its use is not restricted by licensing. And it is available electronically, in vector format, so if a suitable conversion utility were available, it could be converted automatically to OSM’s format. A bulk import of TIGER data was attempted in 2005, but the initial trials failed to produce quality results and the work was abandoned.

In the spring of 2007, Brandon Martin-Anderson and Dave Hansen undertook a brand new effort, hunting down bugs in the previous conversion and import code, and starting fresh. Martin-Anderson had written TIGER parsing code before, and with some help from other OSM developers worked it into a TIGER-to-OSM conversion script.

Attribute Mapping

The time-consuming part, he says, was mapping attributes from one form to the other. “People have a lot to say about how various TIGER tags are converted to OSM tags, whether an A-class TIGER road is residential-class OSM road, et cetera. I spent a great deal more time working out the tag conversion with other members of the community than writing software.”

Conversion

Once all involved were happy with the attribute mapping, Hansen downloaded the entire TIGER data set from the Census Bureau Web site in county-sized chunks, and ran the conversion script on his home computer. The resulting OSM-compatible data set consisted of 379,836,373 objects.

Upload

Converting the data took several days of constant work, but it still needed to be uploaded to the live OSM server. In a postmortem of the attempted 2005 import, Hansen discovered that some of that effort’s problems were the result of trying to import the converted data directly into the database. For reliability, Hansen initially began uploading the newly converted data through JOSM, the client-side application typically used for annotating and uploading GPS traces. This ensured that the TIGER data went through the same API as any other OSM input, averting the breakage associated with the 2005 attempt. It was safer than attempting to bypass the API and alter the database directly.

But, this import method was agonizingly slow.

“I’ve been very painfully uploading the TIGER-generated data through JOSM. At the rate, I’m going it will probably take 5 or 10 years to upload the entire US. I’m uploading one or two counties a day and there are 3,234 counties in the country.” - Dave Hansen, OSM-dev mailing list, August 28, 2007

Eventually, the OSM team devised a better plan. Hansen transferred the already converted data files to a development machine on the same rack as the OSM map server, and admin Tom Hughes dedicated three of the map server’s 12 import daemons solely to the bulk upload.

This improved data import started in early September. Running night and day, seven days a week, the TIGER import should be completed in May or June of 2008. A public web page keeps track of the stats, including the current throughput, percentage of the TIGER data imported, and a list of completed counties.
Although the improved TIGER import is far faster than the old, there is still a long time to wait before it finishes. Hansen came up with a way to make the wait less painful. He began by sorting the counties in the upload queue by population, so the most populated areas go first. Plus, he takes requests. If you want your county imported next, email Hansen and he will bump them up in the queue.

But time is not the only important factor. Shortly after starting the TIGER import, it became clear that the database machine itself would run out of disk space within a matter of weeks. Hughes added additional storage capacity on September 27 and says he is prepared for more complications to crop up along the way.

Quadtiles

One such example is the size of the database index. The team had known for a long time that the existing index was inefficient. The database indexed all of its entries by their latitude and longitude, requiring the lookup of thousands of double-precision floating point values for any given geographic area. Once the TIGER import began, the number of indices shot up dramatically. Luckily, a solution was already in the works. The database switched over to a new index by using quadtiles, dividing the globe into discrete tiles and putting far less strain on the server, resulting in greatly shortened database lookup times.

Quadtiles recursively split each quadrant of the map into four subquadrants, allowing for better space efficiency by only subdividing those quadrants that require more detail. A quadrant containing only ocean and therefore no roads, for example, would not require subdivision, whereas a metropolitan city center would. The quadtile keys are shorter (32 bits as opposed to 16 bytes for the old lat/long indices). Because of quadtiles’ hierarchical nature, geographically close nodes are adjacent in the database index, which improves cache performance.

MapRoulette

The TIGER data set’s successful import does not mean that the work is finished. Users who have collected their own GPS logs in areas covered by the TIGER maps and uploaded the resulting data report sporadic problems with TIGER’s information. Problems include misalignment of roads, missing features, and occasional confusion on features such as cul-de-sacs. Since the TIGER map data was produced from aerial photography, such problems are bound to occur.

An enormous clean up and improvement effort was needed, while the US OSM community was quite small in 2012 (<100 daily active mappers). Something was needed to organize the work. So the idea of MapRoulete was born : a tool to work on small, randomly assigned tasks. The aims were to make a huge mapping effort feel more doable by breaking it up in small tasks and make repetitive mapping more fun.

MapRoulette, the open source web-based micro-tasking platform for OSM, was first announced at State of the Map US in 2012 as a tool to solve the many errors introduced by the import of TIGER road data in the United States. After a successful and quick cleanup of over 60.000 common problems found in the TIGER data, it was clear that the idea of a micro-tasking tool was worth developing further.

MapRoulette proved to be a great way to focus the community on a mapping goal. Now anyone can create challenges on MapRoulette. It’s useful for mapping parties where you want a smaller goal.

References :

  1. Nathan Willis (October 11, 2007) “OpenStreetMap project imports US government maps” linux.com
  2. Nathan Willis (January 23, 2008) “OpenStreetMap project completes import of United States TIGER data” linux.com
  3. Martijn van Exel (August 19, 2022) “10 years of MapRoulette” State of The Map 2022 - Firenze
Location: Perum Bojong Menteng, Babakan, Bekasi, West Java, Java, 17117, Indonesia

On taggings and stylings

Posted by rtnf on 5 September 2022 in English.

There are many local, region-specific, map features that went unrendered on OSM’s default map tile. Most of them even still undocumented on OSM Wiki. Mappers, not finding suitable tag to identify them, trying to encode this information inside some generic tags, like name:* or description:*

Proposing (and defending) new tagging scheme on OSM Wiki is hard and painful. Even if we are successful in doing that, there is still a long way ahead until it finally rendered on OSM’s default map tile.

In short, casual mappers dont see any point in mapping, if their contributions didn’t show up at all on the maps. They collect the data in the hope that this information would be useful to someone out there. Even the time lag between data upload and tile update + re-render is quite frustrating to some mappers.

So, what’s the solution? First, make it easier for anyone to create their own map style. For tags that is still not rendered on OSM default map tile, they can design their own style for that tags. Second, use vector tile instead of raster tile, so the tile update will cost less time.

While stumbling across EWG’s minutes, i found these passages :

  1. Facilitate a framework to use localized styles for osm-carto: e.g. a Polish variant of the style could show parcel lockers on zoom levels only showing parts of Poland, without showing parcel lockers elsewehere and so on.
  2. Offer universal vector tiles, i.e. vector tiles that everywhere contain all OSM data in that tile. This should relieve the technical burden such that people with design focus easier can design new styles.
  3. Write a good tutorial of cartography. If more mappers get capable of designing a style for the cartographic point of view then there should be more and more diverse styles.

I hope they really prioritize this move.


Epilogue : I’m still experimenting the first idea by using Tileserver GL but some reason, there is an unsolved critical bug. I’m gonna throw in the towel, for now.

Location: Blok A, Babakan, Bekasi, West Java, Java, 17117, Indonesia