Alexander Avtanski's Diary
Recent diary entries
GPSMash update - Support for NMEA import, data cleanup updates
Posted by Alexander Avtanski on 5 August 2013 in English.Hello,
I just finished testing the latest update (1.3) of my GPS logfile handling tool GPSMash. The new features in version 1.3 are:
- import of NMEA logfiles
- improved track cleanup algorithm
GPSMash is a command-line Windows application that can repair broken GPX files, clean-up, organize, and analyze data, convert to various formats for visualization, etc.
Here is a sample video using data processed with GPSMash:
Click to play video: http://youtu.be/hAvHgBFEOAc
If you are interested, you can download it from my site:
Any feedback is welcome.
Regards,
Alex
GPS track processing tool
Posted by Alexander Avtanski on 15 June 2013 in English. Last updated on 16 June 2013.Hello,
I’ve been working on a GPS track visualization and processing tool - GPSMash - for a while and today I just completed the first release suitable for public use (most bugs fixed, enough functionality, good documentation). This is a command-line Windows application that can repair broken GPX files, clean-up, organize, and analyze data, convert to various formats for visualization, etc.
Here is a sample video using data processed with GPSMash:
Click to play video: http://youtu.be/hAvHgBFEOAc
If you are interested, you can download it from my site:
Any feedback is welcome.
Regards,
Alex
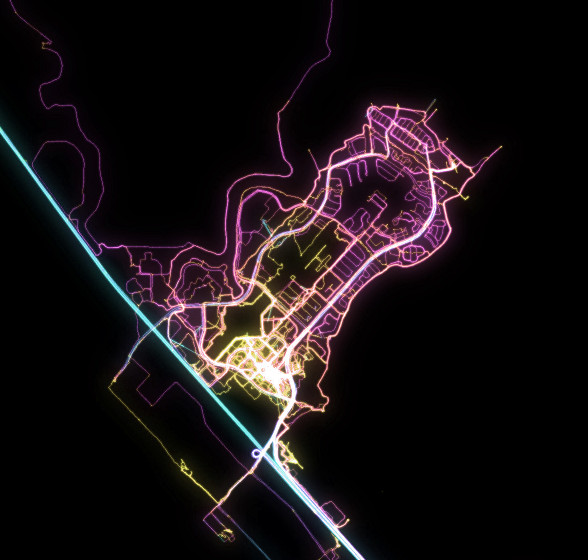
Today I put together one year worth of GPS tracks from my lunch walks and bike rides around the office. The colors correspond to different speeds - yellow is for walking, magenta is for biking and cyan - driving at highway speeds:
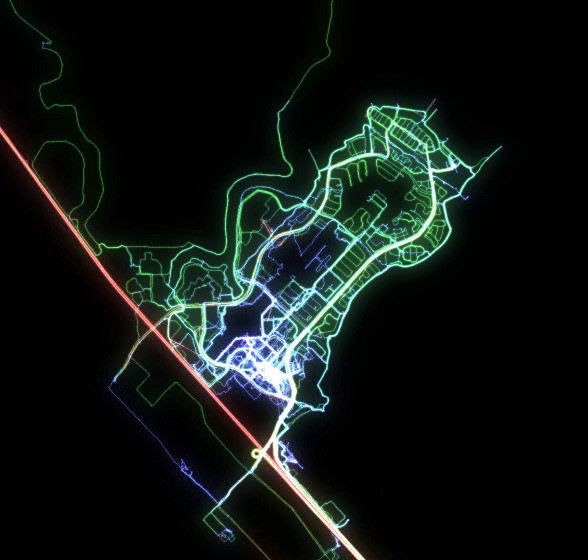
In case you feel offended by the bright neon colors, here is another version (blue = walking, green = biking, red = driving):
If you have tons of GPS tracks and want to visualize them, the tool I’m using is here: http://avtanski.net/projects/gps.
I'm in the habit of always carrying my GPS, recording where I go hiking, biking, or driving. Yesterday, while on a walk, I though that it should be pretty easy when visualizing the accumulated track to use different color for each mode of transportation. So, today I modified my GPS visualizer scripts a bit, adding parameters that allow selection by speed range.
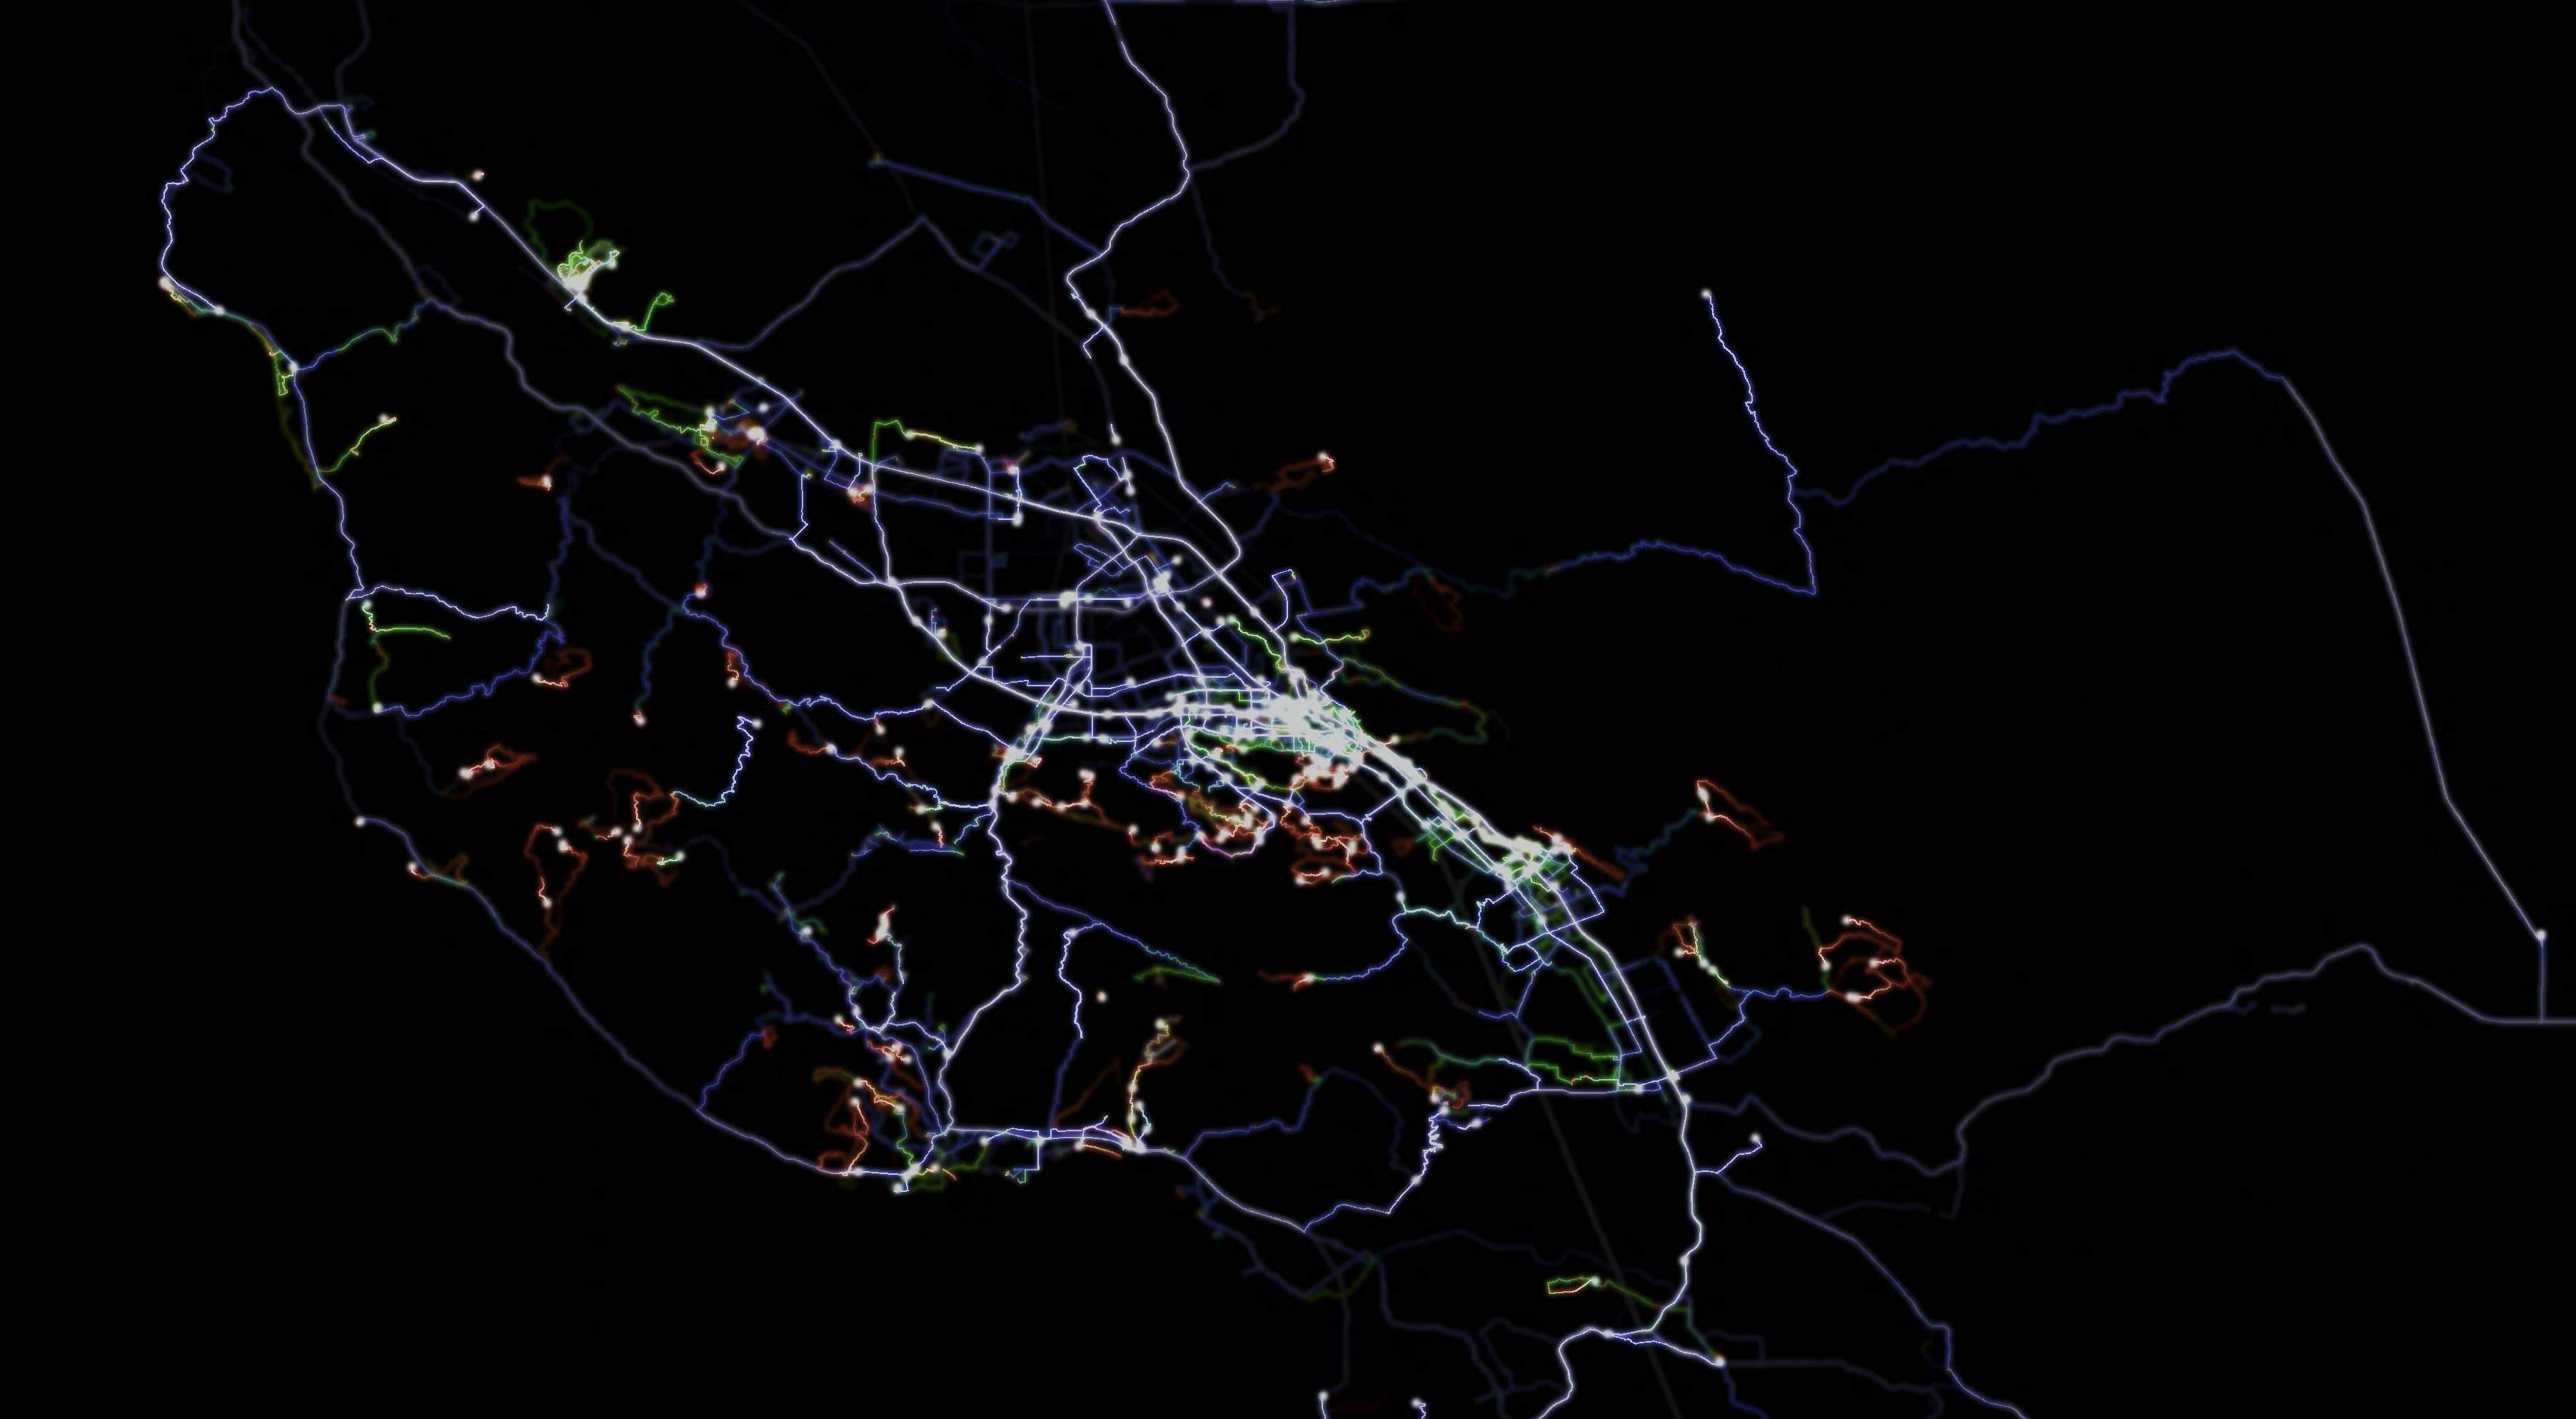
On this image my trips are color-coded, based on the track speed:
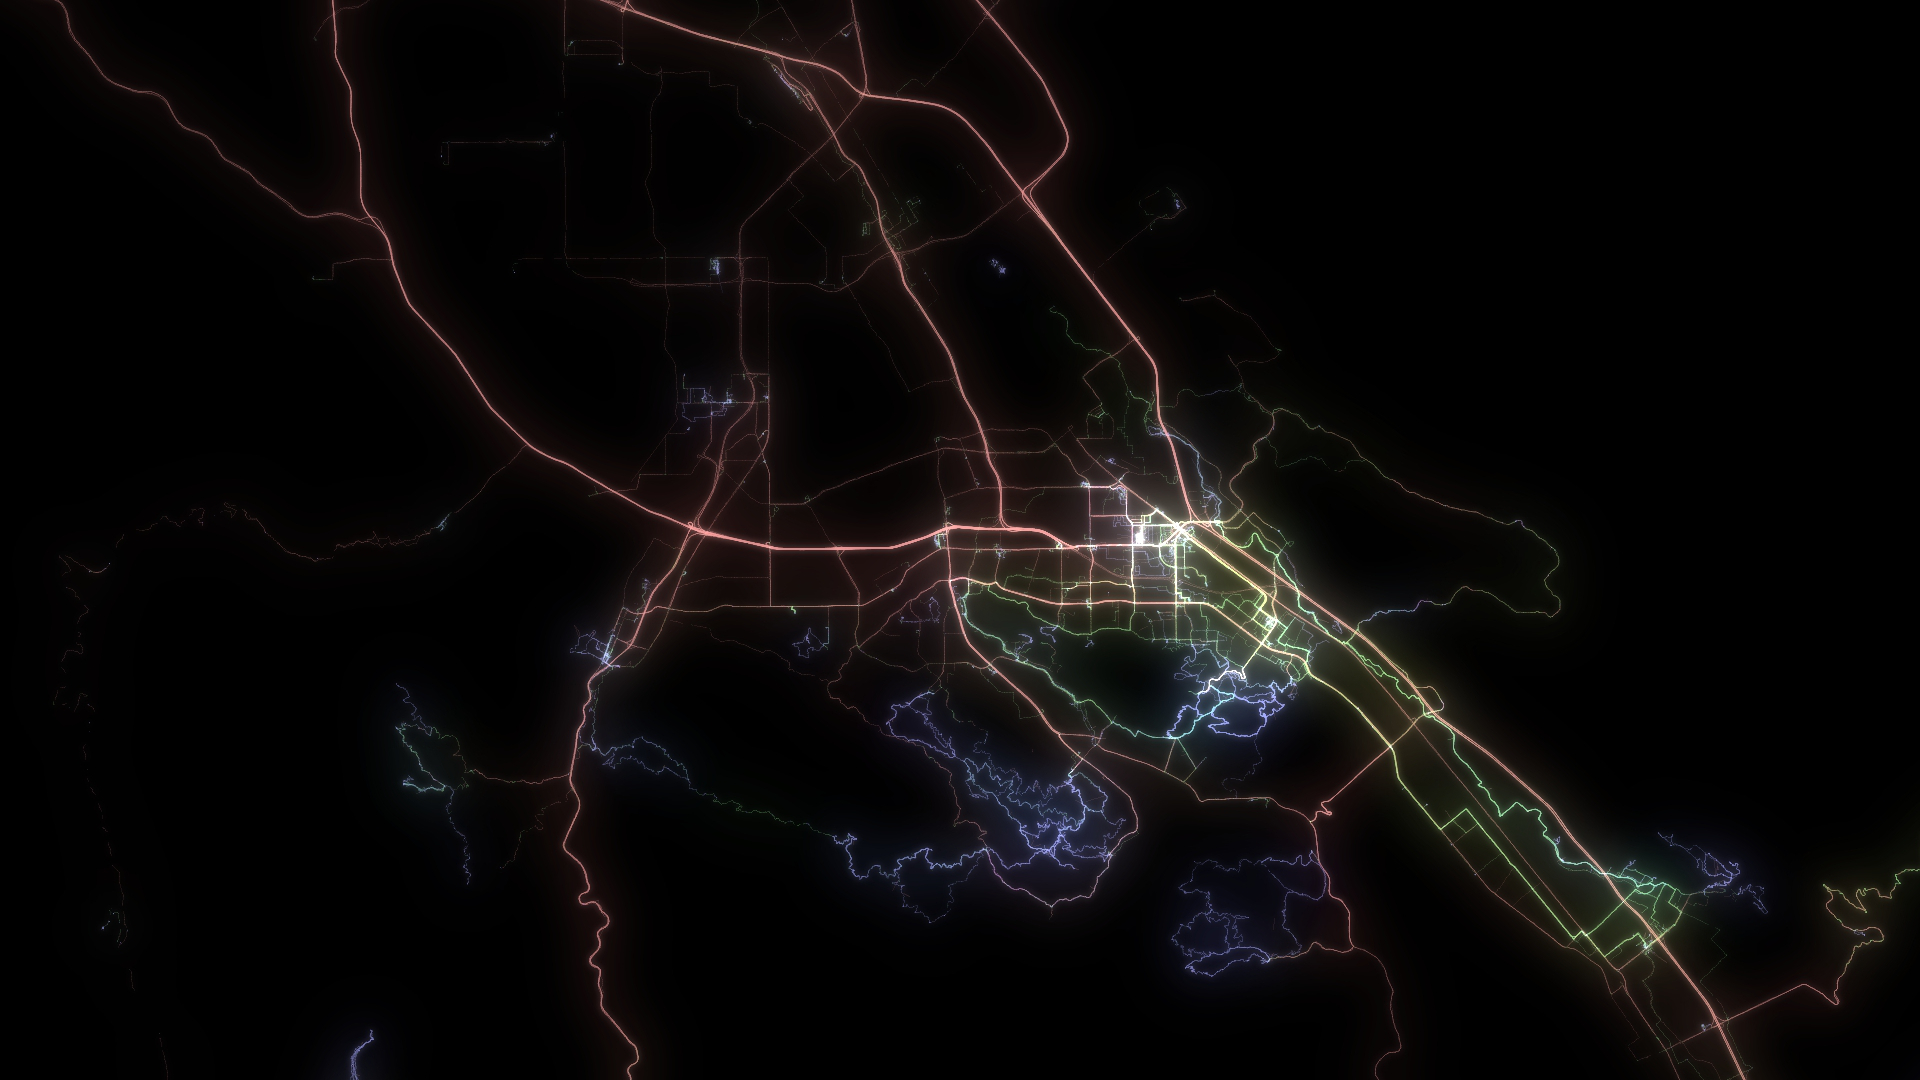
Here RED is Driving (or rather "likely driving" based on the speed range), GREEN is Biking, and BLUE is Hiking/Walking.
If somebody is interested, the visualizer scripts, some more images, and a sample video can be downloaded from here:
http://avtanski.net/projects/gps .
Three years of dragging my GPS around with me...
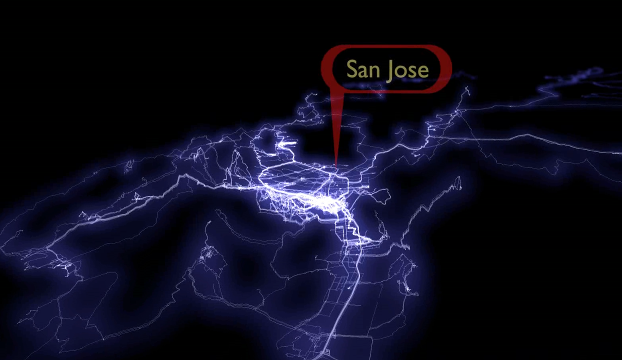
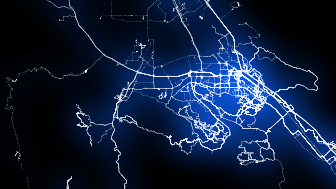
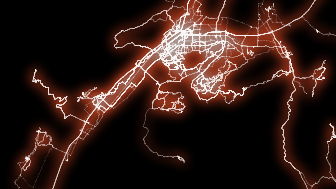
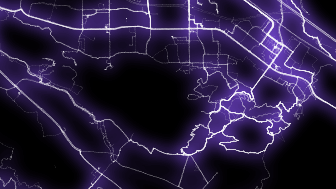
Posted by Alexander Avtanski on 25 May 2011 in English.I recently [re]discovered the years and years of accumulated GPS logs that I had from dragging my GPS with me on every hike or drive and decided to do something with them. After some Perl scripting and ImageMagick processing, I got this:
Click on the picture above for a full size view of this and other images.
BTW, this is my first diary entry - I hope the HTML works... If not, the URL is this: http://avtanski.net/projects/gps. The track visualization video is here: http://www.vimeo.com/23697355