OpenStreetMap

Harry Wood's Diary

Recent diary entries

OSM editing streak fail

Posted by Harry Wood on 17 January 2023 in English.

At the new year I had the crazy idea to go for a 2023 OpenStreetMap Editing streak (Try to do at least one edit every day). I knew I wouldn’t manage to go the whole year, but once you start doing these things on January 1st, you feel compelled to carry on.

But I only managed… two weeks

How Did You Contribute tool

This is a screenshot of part of the “How Did You Contribute” tool. Designed to look like github’s profile section for showing off your contributions (Lots of other neat facts and figures besides that on that tool).

I forget who it was, but I’ve seen at least one person showing off their OSM edit contributions covering an entire year for 2022, and some other folks doing it in previous years, and thought I should be able to manage it myself. In principle it’s not that hard. It’s easy to find edits to do. The hard bit is just making sure you edit every day. Even for this short two week period I had a couple of minor panics as I realised I needed to get an edit in before midnight, and a couple of nights where I’d gone to bed early and then remembered to make an edit using vespucci while in bed!

I’d forgotten about “OSM Streak”, the little app dedicated to this idea. You sign on, and it gives you points for keeping your streak going, with suggestions for simple edits to make. I think it sends you reminder messages too, which sounds helpful.

I don’t think finding simple quick edits was ever going to be a problem for me. I have many unprocessed survey photos which, if I were to work on them bit by bit, could easily be strung out to half a year’s worth of editing. I also found it surprisingly easy to (in those bedtime vespucci sessions) think of edits to make in my neighbourhood with more detailed tags I’d forgotten to add e.g. whether local cafes have internet & outdoor seating. I suppose I would’ve run out of those fairly soon though.

Of course there’s always HOT mapping. I didn’t do much of this but, tasks.hotosm.org offers an endless supply of edits to make. They’re not always super-quick, for example if I do straightforward mapping of a square, I find it can take a surprisingly long time (although there are ways of choosing quick tasks). Of course you could dip in to a task before releasing it back to a yellow state: “Is this task completely mapped?” -> No. Validating a square is quicker, but for this purpose (if we’re being lazy or in a hurry) we want to find one which involves a quick bit of editing before marking as valid.

I also didn’t get onto Fixing multipolygon areas, or any of my other old armchair mapping favourites, or finding new one’s on MapRoulette. The possibilities are endless…

…but my editing streak was all over when I fell asleep while reading bedtime stories to the 7 year old, and didn’t wake up until after midnight. I was shattered after hosting a 3 year old birthday party on Sunday!

So two weeks was pretty lame, and yet I’m quite glad it’s over, because despite everything I’ve said about being easy to find edits to make, it’s still not easy to make sure to get the edit in every day. I don’t need that stress in my life!

I actually started to do the same thing for github commits, but as you can see on my profile there, I managed a measly four days of that. Even more lame! In fact it’s a pretty lame performance on my github green chart in general. Github commits are potentially even easier to do, depending on how much of a cheat you want to be, but for genuine code contributions, not really. A minimal code contribution, even a simple improvement to a personal project, is less of a casual undertaking than an OpenStreetMap edit, for me at least. I was inspired by John Resig - Write Code Every Day, and would like to be the kind of person who regularly and casually cranks out public code. Maybe one day.

Hopefully there’s lots of folks doing better than me with their 2023 streaks!

London pub meet-ups and other updates

Posted by Harry Wood on 13 December 2022 in English.

Back in October in we had a London pub meet-up in the Monkey Puzzle pub. It was pretty well attended. There were three or four people I hadn’t met before. For example I was pleased to meet user okwithmydecay. This username was familiar, I think because I’ve just seen him doing lots of editing in London. Good reason to recognise somebody’s username! We like that!

I took along some OSMUK leaflets which I have received a pack of (Order OSM UK leaflets here). I say leaflets, but they’re more like postcards. Single sheet of card. I think there’s five different designs with five different messages/target audiences. Me & Andy (gravitystorm) were critiquing them in the pub, although on the whole we decided they’re rather good, and certainly good that people have organised this.

OSMUK leaflets Harry and Andy

Andy had been in charge of producing/printing/distributing OSM promotion leaflets in the past of course. There’s still some of these around (I had a bundle of these a the pub too), but they feel very out-of-date now, so great that OSMUK folks have had some new designs printed.

We were chatting about my job hunting experiences, looking for a new Ruby on Rails roles, and so naturally the conversation came onto development of the OpenStreetMap website. Although the site might not seem to change much, development of this Ruby on Rails app is actively ongoing (see the commits to master), and there are some priority areas receiving some attention. The folks doing most of the “maintaining” work i.e. reviewing pull requests and setting direction of things… were in the pub! Andy & TomH. Pull requests still come in from quite a few different people, which is great although I think it presents a triaging/tidying challenge for them. Andy was suggesting I could try to help with this, by commenting on PRs to help people towards something merge-able. It’s an area where it’s good to be opinionated on Ruby on Rails coding and issues of code/commit tidiness. I think there are quite a few people trying to help do that too, but maybe I should try to wade in more.

He was also saying that some ideas / PRs, require somebody to take a step back and think about the direction we want to go in, for example with information pages, the help page, the welcome page, the new ‘communities’ page and other ideas for new pages, it’s not always clear if anybody is taking an overarching view of how best to design and name these things and structure their navigation. Things like this are tricky because we’d sort of welcome somebody to sweep in and come up with a plan, but only if they manage to do it competently and persuasively. Otherwise it becomes just another idea that we need to find a way to gently reject.

In fact more generally I think that kind of awkward tension is the eternal struggle. Stuck between wanting to encourage the right kind of contribution and needing to triage contributions that don’t always cut it.

Not wanting to make things worse, I’ve tended to stay out it! But being in a ruby-on-rails job-hunting situation, and having some time to do so, I have in fact made the effort to do some rails code pull requests recently. I’ve found it best to make small changes, seeking areas that are uncontroversial. It still requires patience waiting for them to be reviewed, but quite satisfying to get things merged.

I made some tweaks to Notes, and to the way the “report this note” link is presented, to try to discourage people sending too many reports for DWG to deal with. This issue was one of several pain points reported by DWG. I think it’s good to do some changes to help that over-worked team of volunteers if we can! I’ve seen a list of some other gripes they have, including various issues in the mysterious nobody-gets-to-see-it admin interfaces of the website.

EWG were talking to me about paid ruby development work, paid by the OSMF, which initially included these DWG issues hence I started looking at them. I decided being paid to do these pull requests might be a bit problematic/stressful. I dunno. Maybe I was worrying too much, but the work itself seemed quite interesting to chip away at anyway as a good old-fashioned volunteer developer.

More recently though, I have ended up being paid for a bit of rails development work after all. Not on the OSM website, but coding of the “discourse” fluxBB import script. Hopefully this work will be used soon to bring all the https://forum.openstreetmap.org/ posts into https://community.openstreetmap.org/ . You can see what I did in these discourse PRs and ruby-bbcode-to-md PRs. We don’t need these PRs to be merged before we use them ourselves, which is lucky because the discourse team seem to be ignoring them, or they’re a lot worse at keeping up with PRs than we are! It’s a bit disappointing because I went to a lot of trouble to produce clean well-tested commits which I’d hope can be merged, but …well I guess I should just be patient.

Anyway being paid by the OSMF is a strange feeling after years of being a volunteer only. I’ve often celebrated the fact that OSMF is “entirely volunteer-driven” too, but the fact that we have the funds to pay people these days is a maturing milestone I guess, and it’s an honour to be one of those people! If you fancy getting involved in this kind of thing, especially if you’re a ruby coder, there are more opportunities to do paid development work being organised by EWG. I hope that ends up being a success.

It was nice to be doing a focused couple of weeks of ruby coding work too. I’ve been trying to keep my head in the coding zone, but nothing like being employed to do it! And a little bit of more recent “work experience” to mention on my CV. Who knows, maybe it was important in sealing the deal on the job offer I have just accepted! (Exciting news! I shall blog about this soon)

Anyway. Right now London is enjoying a bit of snow, or my kids are enjoying it at least. I’ve got a horrendous cold. Next week the snow will be gone and the cold will be gone (I hope!) and it’ll be time for…

The OpenStreetMap London Christmas Pub Meet-up! So if you want to join in this pub map chit-chat (we don’t only talk about coding. All manner of mappy conversations!) …then come join us in the Parcel Yard pub, Kings Cross Station Monday 19th from 7pm. All the details on the wiki.

Location: Paddington, London, Greater London, England, W2 6QS, United Kingdom

The Parkland Walk unstyled map printout

Posted by Harry Wood on 6 July 2022 in English. Last updated on 7 July 2022.

Next week we’re having an OSMLondon pub meet-up for the first time in a while. Or at least I am. People don’t seem to like setting themselves as “attending” on osmcal.org, but I don’t think I’ll be alone in the pub. Looking forward to it anyway!

Today I wanted to print out a map of “Parkland Walk”, a local nature trail (and former railway). This was a project for/with my 6 year old son, which I spent a bit longer on than I should have today. In his class they’re doing various activities related to Parkland Walk. I thought it would be fun to give him a big map in style which he could colour in.

parkland walk map printout

The nice thing about a style for colouring in, is that it can be no style at all! Just nice thin lines for every “way” from the OpenStreetMap data was all I needed. I knew that would give him lots of intricate little building shapes and an outline of the Parkland Walk area itself. I thought I’d try send vectors to print to get these lines looking nice and sharp, rather than my old crude technique of screenshotting JOSM wireframe view, and inverting the colours.

So I wanted a simple way to go from an OSM file to SVG. In the end I did it as follows:

  • Download the area in JOSM
  • Delete some trailing “tails” off the edge of the bbox.
  • Delete some unwanted way clutter: admin boundaries and underground features.
  • Save as… and set the file name extension to geojson.
  • Open mapshaper.org in a browser
  • Drag the geojson file on there and “Import” with default settings.
  • Export and select SVG. default settings.
  • Open the resulting SVG in inkscape
  • Select the black background polygons
  • Go to the “Fill” styling options and set fill to none (“x”)
  • Go to the “Stroke paint” options and take it off none onto black colour.
  • Go to File->Document properties and set the page size to A4
  • Resize the whole image to be much bigger fitting to the A4 page as desired.
  • For my case I wanted three different pages to stick together, so I also sized and moved the image to give me the framing I wanted, then moved it again for each page one-at-a-time.
  • While resizing I also stretched the image vertically a bit to crudely compensate for losing projection information.
  • After making it all bigger, the line widths are relatively thinner which looks a lot better (unless you resize line widths too), but you may want to set the “stroke paint” line widths thinner still.
  • Add a little OpenStreetMap credit text in the corner.
  • Send to print! (Or save as PDF)

Here’s how it looked in inkscape at the end:

framing A4 print area in Inkscape

I tend to think in terms of SVG when it comes to vector printing, maybe because I enjoy being able to preview and post-edit things in inkscape. But perhaps I should learn to do these things in QGIS (and print direct from QGIS). Certainly seeing things like 30 day map challenge it became more clear to me that people do produce finalised polished map output directly in QGIS (or ArcGIS etc). And I see it has a clever print layout options. Admittedly I’ve only ever used QGIS for fuddling around and converting from shapefiles and maybe doing geo operations (calculating buffers etc).

I have used Maperative to create styled SVG in the past, and I would recommend it. Excellent SVG output with useful object groupings once you get it into inkscape. But is .NET stuff a bit messy to install on mac?

As mentioned, I’d decided I didn’t need any styling, and so installing either QGIS or Maperative seemed like overkill, but actually I did start looking at those basic lines for roads, and started thinking these could be more fun as areas to be coloured in (introduce a bit of styling).

Also the “simple conversion to SVG” wasn’t as simple as I’d hoped. Quite a few steps in my list above, buts that’s not counting all the experiments and dead ends I hit. I hadn’t used mapshaper before, but followed this answer to arrive at that. I did also follow the instructions to install and use osmtogeojson before realising that JOSM can simply save to geojson! So that’s something which turned out to be pleasingly easy. Could JOSM make that more obvious? A file type picker? A separate “Export as…” menu option? Also should JOSM be writing projection information into geojson? Or what option should I have used within mapshaper to specify projections? …Or could JOSM just save as SVG? Casual feature request :-)

There’s a quite a few different ways to create an SVG map from OpenStreetMap. I remember working on building that wiki list a long time ago, and I see it has been extended since. Please do edit if it’s missing any good options.

Anyway once the six year old got home, his first challenge was to stick the three sheets together, lining things up properly. After that I thought he’d launch into colouring in all the little buildings in a rainbow of different colours, but he’s been learning about maps and so he immediately said “We need a key” and went on to choose a few specific things he wanted to colour in (and add to the key). So it kept him entertained for half an hour. It kept me entertained quite a lot longer than that!

If you’d like to help keep me entertained… come to the pub with me! We’ll be in the Jack Horner on Tottenham Court Road next Tuesday evening. All the details.

Location: Crouch Hall Park, Crouch End, London Borough of Haringey, London, Greater London, England, N8 8HL, United Kingdom

Some picks from the 30 Day Map Challenge

Posted by Harry Wood on 7 December 2021 in English. Last updated on 12 January 2022.

“30 Day Map Challenge” happened over November. Remembering this from last year, I knew we were in for a bombardment of cartographic creations on the #30DayMapChallenge hashtag. Combining this with a search for “OpenStreetMap” mentions I sat back and let the mappy goodness flow into my tweetdeck for the whole month.

30 Day Map Challenge daily challenges

Here’s some I particularly liked:

I’m sorry, this diary entry would be much more fun if we could embed tweets, or otherwise put the images all on here. You’ll have to open them all. It’ll be worth it! Alternatively you can look yourself through the whole lot of tweets mentioning #30DayMapChallenge and OpenStreetMap. There’s a lot!

As usual with such things, a large part of me wanted to take part myself, but… a map creation every day? I admit I predicted I would fail and so didn’t even try. Hats off to all the dedicated folks who saw it through. I confined myself to “liking” them all on twitter.

I also retweeted some maps from @OSMLondon (any featuring London).

And speaking of OSMLondon… in October we got back to the pub for our first real face-to-face pub meet-up since the pandemic. That was great! And we’re going to do it again tomorrow night! If you’re in London, come along and join us. All the details on the wiki

Northwick Park Hospital buildings

Posted by Harry Wood on 19 May 2021 in English. Last updated on 23 May 2021.

Last night I sat and armchair-mapped a load of hospital buildings for Northwick Park Hospital here in North West London

Northwick Park Hospital before-after gif

I tend to follow a rule of no armchair mapping in the UK these days, but I have a few extenuating considerations where I allow myself to break that rule. This is a big hospital. It’s the kind of thing we should certainly have mapped properly across London and the whole UK. I’ve armchair-mapped quite a few hospital buildings like this in Africa after all! I wonder how many other UK hospitals are missing building detail.

Actually the omission seemed wierd to me, as if maybe the buildings had been mapped but recently deleted. I thought it looked as though somebody had swept in and hit delete but missed just one or two little buildings (that little dentist), but how to prove it? I spent some time trying to figure out if I could find deleted nodes in a very constrained bbox e.g. using Overpass date features, but I gave up. Finding deleted data is difficult.

Denying the chance for somebody living locally to take care of their map, is the micro-harm that we potentially do when armchair mapping. I started by putting a simple note, and waiting 3 months, partly in the hope that somebody living more locally might see that.

The missing buildings were actually pointed out to me by SK53 during our London virtual meet-up. I suppose this is the main extenuating consideration actually. I sort of feel like if people are having conversations about bad data, then somebody really ought to go ahead an fix that bad data. So yes… It’s fixed! Although actually I’ll drop a couple more notes where I remember aspects of the imagery being a little unclear. “Survey needed”. And of course surveying could add much more detail. Footway connectivity outside and maybe even inside. Names of more of the buildings. etc. So if you do live local… get stuck in! I wonder what’s the best example of hospital detail in the UK. Cambridge and Edinburgh can be relied upon to provide pretty good examples!

Speaking of that London virtual meet-up… we should do another one! Or maybe even a real pub meet-up again some time soon! I’m still pondering other virtual event formats too. That last one was fun, and was basically a great chance to catch up between friends. For the first few hours we didn’t even talk abut OpenStreetMap much. Later on the zoom call I thought about how to direct the conversation back to OSMLondon, and so I shared my screen and started panning around the London map at random. As expected this prompted a few conversations including SK53 pointing out these missing hospital buildings. I’d like to do something like that again. Or what’s the best map/data view to prompt interesting conversations I wonder?

Another thing: I’m still “between jobs” at the moment which means, while I’m not exactly at a loose end (With job hunting and kids I’m feeling surprisingly busy still), it occurs to me I could run some kind of virtual OSM event during working hours. Crazy idea? It would suite me a lot better actually, but would rule out most of the normal crowd I’m sure. Could be good for attracting different kinds of people. Maybe we can do both. Let me know what you think.

Update! OSMLondon zoom call scheduled for 8pm on Sunday 23rd

Location: North Wembley, London Borough of Brent, London, Greater London, England, HA0 3SB, United Kingdom

New hyper-detailed garden fence mapping in London

Posted by Harry Wood on 18 August 2020 in English. Last updated on 29 November 2021.

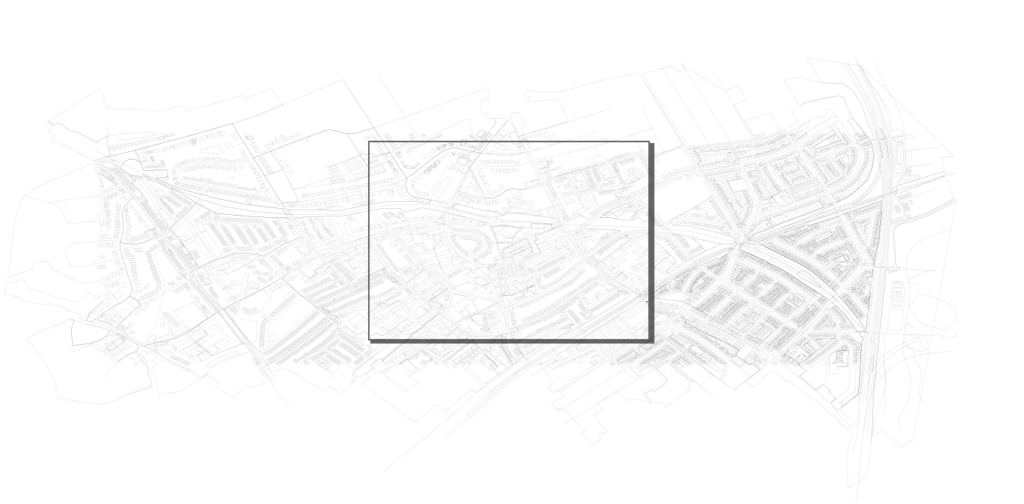
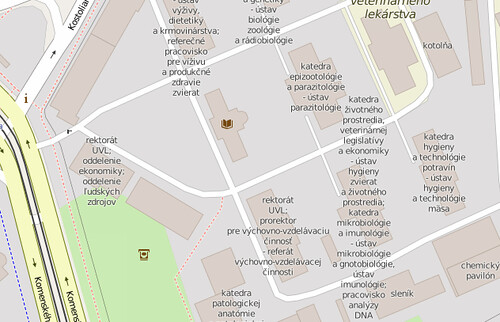
A few days back I noticed a new patch of hyper-detailed mapping appearing on the London map here near Stroud Green Road, with gardens and garden fences all drawn in. It’s impressive! It looks amazing if you zoom in on that patch:

Stroud Green Road garden fences patch

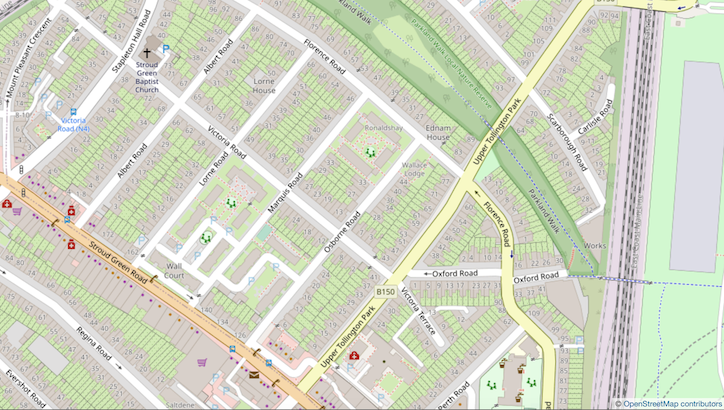
But I felt some frustration when I first saw it, because of the old imbalance of detail issue. I don’t mean to say I’m angry with someone for adding this detail. It’s more a case of being frustrated by an OpenStreetMap problem which we collectively never solved, and I’m frustrated that I can’t actually think of a good solution!

In London for a long time the hyper-detail has mostly been about buildings data. A decade ago as I was organising regular mapping parties, I tried to encourage people to think about building data coverage and to tackle this massive mapping task in something resembling a logical order. Read my diary entry (with coordination animated map) from back in 2010. Back then the default standard style showed buildings a lot more prominently. Dark purply brown, and to quite low zoom levels. Thankfully it was since toned down to a more subtle beige but even so, buildings are very noticeable, and it looks wrong/confusing when patches of buildings appear in sporadic illogically arranged areas. (Maybe this requires a leap of empathy. Imagine for a second, you’re just looking at the map without knowing about how it’s created!)

I think we did quite well at filling in the city centre a while ago. Before that we had major buildings in the city centre missing and yet these random residential estates appearing.

It’s with this problem in mind, that I held back on mapping houses in my neighbourhood for years. Instead, when mapping locally, I focussed on mapping all the shops. These I would map with their buildings because it looks OK (logical!) to have shops showing more prominently than the surroundings.

But I’ve watched residential (i.e. all buildings) data coverage growing. It comes in patches as individuals do their areas. I remember a massive patch to the north of me all got filled out very quickly all at one. That raises an important question about armchair vs survey mapping. Personally I try to do a full addresses survey at the same time as adding residential buildings, but I always assumed that en-masse armchair mapping of London buildings would happen sooner or later regardless of objections. And I assume that was the case for this new north London patch. I’m thinking of Finchley or Barnet or Walthamstow maybe. These places with buildings but not addresses, but…

These days they’re all merging into one mega-patch ….which is what we want! And so it was a couple of years ago that I realised it was time to finally map all the buildings in my neighbourhood, because if I didn’t do it, somebody else would, and I couldn’t have that! But actually (with all the address surveying too) it’s a super slow process, and I haven’t been able to push back my “fully buildinged radius” as far as I would like yet. I do look forward to the day this patch feels more joined up eliminating some of the funny gaps to the south of where I live. With a bit more surveying effort, maybe in a couple of years time my bit of North London is going to look beautifully consistently detailed at last.

…or it would have. But suddenly a few days ago…

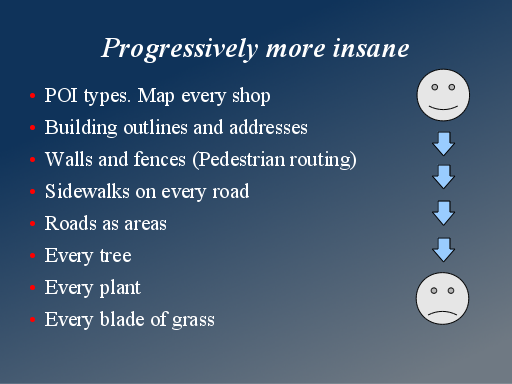
So you can see this is not a new problem for me to worry about, and that’s before I mention my 2011 SOTM Denver presentation in which I described the hyper-detail issue in some depth. Partly I added those slides because I was worried I might be boo’ed off the stage by the Americans if I just presented a “surveying good, imports bad” message, but this issue was playing on my mind in relation building coverage and it also relates to crazy hyper-detail coming from tagging ideas and discussions of things like mapping roads as areas. Different, but perhaps part of the same problem. Patches of imbalanced hyper-detail where it feels like we have no hope of “finishing” across a wider area, and which work against (and perhaps render impossible) the aim of achieving consistent balanced map coverage.

progressively more insane. slide

I also mention another side to the problem. “it’s a waste of time and energy of the mappers doing it, but It becomes more a problem too when people encourage others (including confused new mappers) to follow their lead”

But I say these things without suggesting a solution. The only idea I had in the direction of a solution was the following:

“This runs quite contrary to the way we’ve celebrated detailed mapping in the past, but perhaps we need to think about a new message. Among our pro-mappers perhaps the message should be: “consider the levels of detail around you”. Don’t go crazy with the levels of detail within your blossom of map coverage. Keep a cap on this and map further afield instead. Go to a level of detail which is realistically attainable by you, or with the help of other mappers, across a wider area.”

But I’m not sure how we would ever engender a new community mapping message like that, even if I could persuade more people that we wanted to. I don’t think it makes sense to be telling anyone off for adding detail. That’s why it’s a problem without a solution as far as I can see.

Anyway I thought the new patch of garden fences was an interesting reminder of that general issue, and it bugs me that this is going to be an ugly imbalanced patch of map I’ll be looking at for years to come now. However there’s a few thoughts which make me feel better about this:

Firstly in the twitter conversation about this, people pointed to Edinburgh where there has been loads of garden fence detail added in recent years. Always inspiring to see people getting on with it and proving it can be done. And what I think they have done well at, is that thing of adding the new detail logically in a centre-going-outwards formation. That feels important to me, thinking from a user perspective. For example a map user may look at the imbalance of detail here asking themselves “why does one side of House O’hill Road have those details, and not the other side?” but zooming out, an answer becomes apparent. Even if we don’t like the missing data, we can see the logic of houses more central within the city having more map data. The coverage is clearly expanding westwards. Looking at the extents of this map detail, you can see that the Edinburgh community have done reasonably well at working outwards from the city centre. Some good coordination. It can be done!

Secondly, it occurs to me actually that the stark difference in detail level my eye is bothered by around Stroud Green Road, is mostly due to missing buildings coverage. It does make me think the gardens mapper should’ve done more of that first but I also realise if I can map more buildings, or if the patch of mega-detail spreads over areas of missing buildings, then the imbalance will be lessened. The garden fences detail makes the map a look a bit different, but when zoomed out it really just shows up as a hint of extra green from the gardens, comparing with buildings-only coverage. Not so imbalanced. It’s motivation to get more buildings mapped!

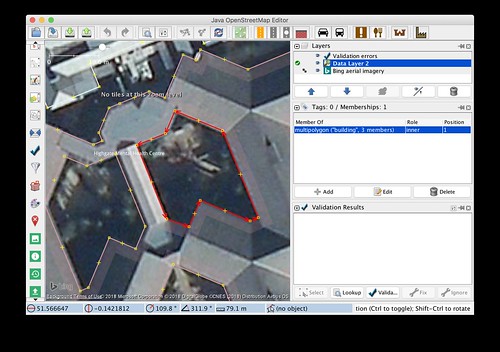
Thirdly, although we might think of garden fences as a next-level upping the ante on detail level, and naturally part of me is worrying “should I have been surveying to that level of detail all along? Am I going to have to go back and re-do all those houses?” …you can’t actually survey garden fences very well anyway. I suspect the reason this particular kind of detail has suddenly appeared in 2020, is more to do with the bumped up quality of bing imagery we’ve seen this year. I think this means that (when the time comes) I, or somebody else, can reasonably go back to any residential streets I’ve already mapped, and sketch in the garden fences from bing. No need for special surveying. There’s some exceptions to this logic. Places where you can see garden fences on-the-ground, and where mapping them accurately may be significant, but actually I’ve often been mapping them in those kinds of places anyway. e.g I’d put a wall like this to illustrate the pedestrian non-access situation. Maybe it’ll be a big armchair mapping exercise in years to come to even out the coverage of gardens with garden fences.

I updated the “Long Names Of OpenStreetMap”.

theatre example

Now there are 722 long names, that is, objects with a name longer than 150 bytes.

I haven’t run a full update since October 2017. Back then there were 464 long names. So I guess we’re getting worse at keeping our names short.

It looks like bus routes with very long name values are becoming more widespread. For example here is the “391 “B”: Veresegyház, Misszió Egészségügyi Központ => Veresegyház, Dukát utca => Veresegyház, Cserje utca => Veresegyház, Eötvös utca => Veresegyház, Újiskola utca” bus route. Snappy name!

Maybe I should’ve limited by character count rather than bytes. Cyrillic scripts are at a unicodey disadvantage, not to mention chinese.

Not all of them cause wacky rendering like the theatre example in the screenshot above (node).

I do think they all have something in common though. Using the name tag for something which isn’t really a name.

There’s some more details and comments on my original diary entry about this. From a tagging policy perspective there’s a discussion (so far just between myself) on the wiki: “Very long names. bad practice/bug?

A little shop contact page ...with OpenStreetMap

Posted by Harry Wood on 5 June 2019 in English. Last updated on 6 June 2019.

A rare thing happened with some shop mapping I was doing just now. I was adding “HOM Concept” from my Mapillary view out of a bus window. I looked up the website of the shop …and look! OpenStreetMap!

Imgur

Actually it might be the first time I’ve ever come across a contact page for a small London shop (just a few branches) as I was mapping, and found an OpenStreetMap map.

I have noticed OSM maps popping up around the web more and more lately. That’s something I’ve always pondered ways of encouraging, dreaming up quite a few different angles on the challenge of attracting web developers to use OpenStreetMap, but I guess it’s predictable that the thing which really shifts them off google maps is google maps themselves, as they start getting more strict with charging for high traffic.

I find it significant to see something like the HOM concept website using OpenStreetMap because it’s a very small organisation. I guess they will have paid somebody to do a quick web-design job for them, and that somebody has chosen to quickly do the map with OpenStreetMap, which is great to see! Also great to see not-the-standard OpenStreetMap tiles, both from a tile usage policy point of view (We want web developers to get maps from a diverse range of tile servers, not always hitting one central OSMF hosted server) and because the choice of a black ‘n’ white style (wmflabs tile server) with a yellow marker fits rather well with their colour scheme.

There’s a few not so great things. Some folks will have already spotted the lack of OpenStreetMap credits. In fact they seem to have accidentally covered them up with a black box. It only happens if the browser is wider than 1060px actually. Otherwise the layout is completely different and the normal credits appear on there. This black box is some weird scroll progress bar widget which seems a bit pointless. So that’s annoying, but we know people make mistakes like that. What else?…

Call me a stickler, but I feel a contact page map marker really should point at the right place… like really… I find it quite unfathomable that someone would put together a map for users to find a business, and then put the pointer in the wrong place! And yet I’ve seen it a lot. One cause I’ve noticed is that some google map widgets can be set-up, not with coordinates, but with a geocode happening every time on an address or postcode, which obviously might then be a little off (even so, you’d think the web developer would notice this and think maybe it’s something they ought to find a way to fix). That’s not the case here. They’ve just coded coordinates in the wrong place. Should be more like 51.58697/-0.10138.

But while we’re looking at the marker position, d’you notice something else funny about it? This is another thing I notice web developers getting wrong a lot. Never with google maps. Always with leaflet. I’d like to say it’s only a mistake made by novice web map developers, but I had to point out and fix the same mistake on the map marker of the State Of The Map website last year. Is nobody else noticing this? Well maybe I’ll leave that as a puzzle for you, because I think it deserves it’s own separate blog post.

It’s fun to grumble about other people’s web map mistakes. But it’s more fun when people mess up using google maps. On the whole my primary message to “HOM Concept” web designer would be… “Yay! OpenStreetMap!”

Using Rob Whitaker's tool to map UK Public Rights of Way

Posted by Harry Wood on 25 September 2018 in English. Last updated on 20 November 2018.

We’re coming to the end of the UK quarterly mapping project on footpaths.

The designation=public_footpath edit tracker

…is running for just 5 more days. So last chance to get on there UK folks! This is all about our UK system of legally designated “public rights of way”, so if you’re elsewhere in the world you may stop reading now.

You may notice that I only just became a new starter on there myself! This is partly because I found it a bit tricky to understand what we’re supposed to do, but I finally sat down and figured it out at the weekend. Sorry it took me so long, but better late than never, here’s a few quick pointers:

Use Rob Whitaker’s PRoW data comparison tool. There’s a list of regions where he’s managed to get PRoW data.

Drill down to regions -> districts -> borough. You might pick where you live, but not everywhere’s on there. Failing that, try to find somewhere you know. Failing that, I guess it doesn’t matter where you pick.

Now you’ll see a map with lines. Here’s a bit of Watford

flickr

The lines appearing on this map are different colours for different designations. Yellow for footpaths, blue for bridleways etc. More importantly they are Thin: done, Fat: todo. So in the above image I have done the long footpath through Cassiobury Park on the left, hence that yellow line turned thin. The rest to the right are fat lines still to do.

What does “done” mean? Well the lines actually represent local council GIS data. It’s where the council thinks there are footpaths, and where they have official designations as such. Each one has a reference number.

Click the line to reveal the official reference number. Copy that whole title, and put it as the value in the prow_ref=* tag. For example this path has “prow_ref=Watford Borough FP 30” (including space characters)

flickr

The designation=* tag is easier. It’s just one of public_footpath, public_bridleway, restricted_byway, or byway_open_to_all_traffic. Those are our longhand OpenStreetMap values. The official data uses the more compact codes: FP, BR, RB, BY.

So these tags go on the corresponding way in OpenStreetMap, where “corresponding” means all the ways which seem to match exactly or almost exactly with where the path runs in the official data. You may need to set the same prow_ref on several little footpath ways. You may need to divide a long footpath way to match just the length where the prow_ref applies.

If there is no corresponding way, then this is interesting. Maybe you’ve found something missing in OpenStreetMap. Maybe you’ve found something wrong in the official data. Time to dig deeper, or flag it for somebody local to investigate I guess. As the page states, we should not blindly copy the geometry data into OSM from the council GIS data. The page also states the source tag to use on your changeset for the particular district you’re looking at. (e.g. in Watford it’s source=hertfordshire_county_council_prow_gis_data on the changeset). In fact in general the page gives lots of information which is worth reading through. I’m essentially trying to give a summary here. Did I get it right?

So this whole thing is an exercise in ticking off matches with this 3rd party data, by adding in the prow_refs. Like any process of ticking things off, there’s a certain satisfaction in getting it done in an area I guess.

But I have to say (after all this) I haven’t found it all that interesting or addictive to do myself. There’s obviously lots of this matching to do as an armchair mapping exercise, but it would be more interesting to do in an area if I knew it better. I’d probably enjoy doing some bits of West Yorkshire, if that was available. But also it feels a bit like littering our data with 3rd party arbitrary reference codes. prow_ref values are certainly not verifiable on the ground! And they’re “official”, sure, but I’ve come to associate “official” government data in OSM as shoddy quality and limited value (Seemingly the opposite of what many folks think official data is)

I guess the value here is in ticking things off, whittling down towards finding those interesting cases where we might be missing a footpath. So 5 days left. The choice is yours. Go wild adding those prow_ref & designation tags… or don’t :-)

Fixing multipolygons for the renderer

Posted by Harry Wood on 4 September 2018 in English.

Just thought I would re-iterate something imagico blogged about. Some important features may have disappeared from the map near you. You should check! Use the OSMInspector “Areas” view:

flickr

Generally the pink things are more serious data bugs on there I think, and they’re worth fixing because it could be a big building, or local park, or some other important feature which may have recently disappeared. This is due to a change in the renderer. It’s an improvement, but it means it is being more strict about these data bugs, so we need to fix them! (Yes we’re fixing for the renderer, but these were worth fixing before because other systems will always have struggled with this data)

But these bugs generally involve the dreaded multipolygon relations, which are not the easiest thing to get your head around. I took a look just now and found quite a variety of different problems. Some fairly easy (e.g. this one just needed an “inner” way joining up properly to make the whole building re-appear)

flickr

…some not so easy. Problematic relations can be overlapped by other ways. Sometimes the multipolygon isn’t necessary at all (created by mistake perhaps). In that case we should take the chance to convert it to a simple closed way, to make life easier for everyone …but that can be a fiddly process in itself.

So I’m inclined to say we need to pro-mappers to attack this task. But being “pro” is all relative. Most mappers are probably like me. I’ll happily wade in and try to tackle such things up to a point, but then sometimes I hit such a tangle of data, I just throw up my hands and think to myself “either somebody has thought carefully about this data, and there’s a reason it’s like this, or somebody’s made a mess, or maybe both… but I can’t tell” at which point I’m quite happy to leave it and move on to find an easier bug to fix.

So get stuck in! There’s quite a lot to fix:

I wonder if there’s a way of knowing where the BIGGEST multipolygon bugs are.

London OpenStreetMap Q&A

Posted by Harry Wood on 9 March 2018 in English. Last updated on 7 December 2021.

I don’t think anyone blogged about London OpenStreetMap Q&A events yet, but we should! We’ve been experimenting with this new event format in London. Well I haven’t. I’m still setting up occasional pub meet-ups, but thanks mostly to Firefishy’s organisational efforts, we’ve been escaping the pub, and doing something a bit different.

These are presentations evenings, and also (trying to be) an opportunity for discussions and questions, and getting help with mapping or using OSM. We’ve had a few now. They’ve been pretty successful, with increasing attendance each time. On Wednesday night we had maybe 30 people attending.

I’ve been forgetting about the FOSS4G UK conference, which was taking place Thursday and Friday. We missed an opportunity to advertise our thing as a warm-up event to that. Some people figured it out though. Janet Chapman was going on to give a similar talk at the conference, and there was at least one other person who was visiting the UK for FOSS4G UK, and taking in our event beforehand.

flickr

Janet Chapman gave the first talk “Crowdmapping rural Tanzania to help end Female Genital Mutilation and aid development” (Crowd2Map Tanzania). Janet has been well meshed into the London Missing Maps humantarian mapping crowd, and her talk was describing all the various tools (tasking manager, field papers, mapswipe, etc) which she has adopted to good effect for this ongoing Tanzania project. You can join in with this work via ‘Tanzania’ on the Tasking Manager. But this is a great example, not just of humanitarian mapping from afar, but of tight collaboration with the locals. The local activists who are tackling the FGM in Tanzania, seem to be seeing the mapping feedback loop. They’re joining in with contributing data, (on-the-ground gathered data. The good stuff!) because it makes the maps more useful in the areas they are operating in.

flickr

Nick Whitelegg talked about a topic a bit closer to home, “Using OSM for countryside mapping”. The rendering on his website, freemap.co.uk is designed for country footpath users. It colour-codes the paths by their legal classifications. In particular the designation tag is important, or at least it is important in the UK if you want to understand the legal status of footpaths. Nick has been involved in OpenStreetMap since pre-historic times, and in his talk (which went into some technical detail) he described how freemap.co.uk was intially displaying maps built upon the OSM API before OSM offered planet dumps!. He was in this game early! Certainly I remember freemap.co.uk as a feature of the early OpenStreetMap landscape. Nick himself joined the project in 2005!

After those talks we had a little bit of time for a group discussion. I wasn’t sure if this was going to work well, and I had been writing down some ideas for discussion points, worrying that discussion flow might not be forthcoming. No need to worry though…

We had one question/observation from a chap called Will who said he was new to OpenStreetMap and found contributing via mobile apps wasn’t as easy and approachable as he would have liked (although techy himself he was looking for an easy experience to recommend to less techy friends). That was all we needed to trigger a lively group discussion with ideas for app recommendations, ideas for making things easier, ideas about whether mobile apps are a good way to start, all of which burned through the time quite easily, and we had to continue discussions in the pub.

Additionally we had a good long period before the talks started, to chat amongst ourselves. I was trying to advise someone on options and software choices to solve a particular map usage problem. Trying to help people with their map-based projects is one of the main ideas of the event, and the reason for calling it “OpenStreetMap Q&A”. I’m not sure we’ve figured out the ideal format for making that happen yet, but it does happen just with getting people in a room together (with pizza)

Huge thanks to Firefishy for organising and to WeAreFriday for hosting this event! The next one is already being pencilled in. It may happen on the 2nd of May. Join the meet-up group to keep track

Location: Clerkenwell Green, Clerkenwell, London Borough of Islington, London, Greater London, England, EC1R 0EG, United Kingdom

Zoffany Street

Posted by Harry Wood on 30 October 2017 in English.

I just added Zoffany Street to the map in more detail (all buildings and addresses):

Mapping Zoffany St animated

It’s a very short little street. A modern block of apartments on one side, and old cutesy coloured houses on the other. Relatively unremarkable except…

on flickr

UK geonerds may recognise the name, because Zoffany Street was the last street in the “A to Z”. You can read ‘From Aaron Hill to Zoffany St’ bbc article, and many other tellings of this story, but very briefly… The A-to-Z road map of London was first created as a one-woman effort by Phyllis Pearsall. Annoyed about lack of detail/usability in other maps, she decided to do a crazy thing. She went and walked all the streets of London and created her own new map from scratch. Sound familiar? Phyllis Pearsall died 8 years before OpenStreetMap was born, but she surely would’ve enjoyed those first London mapping parties.

In that original A-to-Z atlas, Zoffany Street was the very last street appearing in the index. London got bigger, with more Z’s in there since, but originally Zoffany Street was the final “Z” in the “A-to-Z”! So good job I’ve mapped it properly now.

Location: Archway, London Borough of Islington, London, Greater London, England, N19 3UB, United Kingdom

A few weeks back I gave a talk in London which was a sneak preview of my “Diagrams Of OpenStreetMap” SoTM talk Yes! I’m heading to Japan for the conference soon! I’m the only one from the London crowd going, so this wasn’t a spoiler for anyone in the audience, but this diary entry is a small spoiler. I thought I’d give some details of just one diagram from the talk. This one:

wiki

You may recognise it although I think its “Component Overview” home on the wiki is a bit hidden away these days. But anyway you wouldn’t recognise the right hand side because this is newly redrawn as of last night! In fact I’ve done a few iterations which I am unveiling as part of the talk. The left hand side editors were given an update, but last night I was tackling the more tricky right hand side where we try to show different rendering stacks and map display approaches available and used in the wider ecosystem.

flickr

Up until last night this simply described one possible “TileMill” set-up. That technology is a bit obsoleted by Mapbox Studio these days, but more importantly it’s only one of a range of new tools. So to iterate on this, redrawing a little bit, I’ve aimed for a more high level summary of tech concepts on the right.

A key new technology concept which is very much part of this landscape now is “vector tiles”. Been around for a long time of course, but these days lots of folks are making very practical use of OSM vector tiles within commoditised rendering stacks and other tools. Time to bring it into the diagram. Hopefully I’ve connected things up reasonably correctly. Vector tiles can be used as a data source fed into good old raster tile rendering, but they can also be fed direct to the browser to be displayed there instead of raster tiles. That happens usually still with the use of LeafletJS via tools which I’ve collectively called “Vector plugins”

That’s my understanding. But I’m a little unsure of the details. The level of abstract summarisation here is avoiding the details, but I would like to see a diagram which shows more specific technologies. Probably a different diagram, rather than trying to add it all on here. Something with boxes for: Mapbox studio, Mapbox GL, Tangram, Tangram Play, ThunderForest’s stack, OpenMapTiles stack, and the different vector tile formats, schema formats, style sheet formats, etc, etc. A layered diagram summarising all things vector tiles. That’s a difficult diagram for me to draw, because I am shaky on the details and generally finding some of the linkages unclear, but maybe that’s a clue that this will be a useful diagram!

Maybe I’ll create something myself in time for the conference, but maybe not. Do let me know if you know of any existing diagrammatic efforts in this area. In fact let me know if there’s any diagrams you think deserve a mention, whether on similar tech topics or something completely different. I’m ruling out auto-generated “visualisations” from my definition of “diagrams”, but other than that it’s wide open to all sorts, and I’m hoping to give a bit of a tour of a wide variety of “diagrams of OpenStreetMap”.

Mapping Grenfell Tower

Posted by Harry Wood on 12 July 2017 in English.

A month ago the Grenfell Tower fire happened, killing >80 people. Back in 2009 we did an OpenStreetMap mapping party near Latimer Road, and I remember mapping the area around Grenfell Tower.

wikimedia
Grenfell Tower as it was in 2009 - cc by-sa, R Sones

We were quite adventurous with our mapping parties back then, often travelling to corners of zone 2/3, meaning somewhat outside of central London, where the landscape is various flavours of urban, not quite suburban. This particular area always stuck in my memory as one of the most starkly mixed wealthy and deprived, or as I put it at the time “concrete estates and super-posh georgian terraced houses strangely existing side-by-side”.

Well ok so if you read exactly what I wrote at the time, I may have described them as a “horrible bunch of dodgy concrete jungle housing estates”, which seems harsh and insensitive in retrospect, but I did form an impression of the area which included some sort of admiration/pride, thinking it’s cool that we live in a city where rich and poor communities live side-by-side.

It was strange and tragic then to recognise the area on the evening news, and to see reporters remarking on what a mixed area it is. The fire was a huge screw up from several more pragmatic angles, but thinking philosophically, it feels like a failure of London to bridge the wealth divide.

But never mind wider society, what about OpenStreetMap?! I think it’s great that my OpenStreetMap adventures have lead me to explore this kind of neighbourhood, although in truth I don’t think I actually surveyed Grenfell Tower up close. I think I remember deciding to stick to the more pleasant mews to the south and didn’t venture round the back to the base of Grenfell Tower. While I appear to have notched up the first version of the building in the editing history, I think it was just pre-sketching from Yahoo imagery, and viewing it from a distance.

As has long been pointed out by Muki Haklay in his academic research (e.g.), OpenStreetMap doesn’t always succeed in “democratising” to the extent we’d like. After all we’d really like the people living in these estates to map them for themselves. Even so, an OpenStreetMap mapping party got me out exploring these areas of London I wouldn’t otherwise have visited and wouldn’t otherwise have paid any attention to.

Location: Lancaster West Estate, North Kensington, Royal Borough of Kensington and Chelsea, London, Greater London, England, W11 1WG, United Kingdom

We’ve got an OpenStreetMap London pub meet-up tonight!

We’re managing them approximately monthly these days, so last month we had a pub meet-up to kick off 2017. We went to the Wenlock Arms. It’s a nice little pub which almost got demolished but was saved after a campaign. Now with all the big new buildings around it reminds me of the very last scene of Batteries Not Included. But they have modernised a little. I remember their rather sparse pub website used to link to OpenStreetMap, but sadly their website was since rebuilt by some boring web designers with boring google maps.

I remember it used to be good for real_ale=yes, and that was certainly there still. Crazy strong stuff. Luckily I’d stuffed myself with fish n chips before arriving because food=no! But it does have real_fire=yes!

on the wiki

(Another photo for the real_fire=yes tag)

So with strong beers and a glowing fire we quickly got chatting about all things OpenStreetMap. I’ve lost my notes, but I remember meeting Scott Davies and talking about Australia and Walthamstow. And meeting two guys from Geolytix who I keep hearing about via Open Data Institute connections. They provide data on ratail outlet locations using OpenStreetMap among other sources.

Good to have some new folks along. If you fancy joining us for the next OpenStreetMap London pub meet-up… it’s TONIGHT at the Blue Posts. All the details on the London wiki page. You can also sign up on attending.io if you fancy it. If you’re not sure how to recognise us, the above photo will give you some idea, but it’s a good idea to turn up a bit late (like 7:30 onwards) By then we should’ve assembled in our maptastic huddle. I’ve got my hi vis jacket with me to today, and I’m sporting my navy blue SOTM 2016 T-shirt in celebration of the fact that I’ve got my flights booked for SOTM 2017!

Location: De Beauvoir Town, Dalston, London Borough of Hackney, London, Greater London, England, N1 4DA, United Kingdom

I was meaning to say (and left it a bit late) it is a great honour to be nominated for the OpenStreetMap awards.

I have realised recently, with some embarrassment, that despite trying to contribute in many different areas, my greatest contribution to OpenStreetMap has almost certainly been my diary entries about people sitting around in pubs! :-)

montage of OpenStreetMap pub photos

flickr

I think my pub diaries date back to 2008 some time. I started writing them as a way to promote our London meet-ups and also to try to inspire others to run similar events worldwide. Hopefully it succeeded in that aim to some extent. But it also developed into a sort of newsletter with a mixture of sometimes current, sometimes just random, topics in and around OpenStreetMap, mixed with some of my own half-baked opinions and opinions of others around the pub table …if I agreed with them ;-)

It turned into quite a habit, which I felt I should keep going. I even became quite organised, by actually writing notes in the pub. I adopted a sort of stream-of-conciousness writing style. Nothing too polished. I think this helped make it a bit less effort, but even so, it added up to quite a lot of effort over the years. It’s nice to have this recognition of my primary OpenStreetMap talent: writing about people in pubs!

I think that Zverik has done a great job putting together these awards. It’s an idea I’ve pondered in the past, but never got off my ass to do. I hope they’re considered successful, and become a regular annual fixture to recognise more people within our community. Hopefully it will motivate people. Hopefully it won’t make people feel resentment. Probably it won’t do either of those things all that much, but…

I think it feeds nicely into another positive effect. Thinking about OpenStreetMap “storytelling”, things like this create a “human interest story” where previously we may have missed it. Take the “core systems” category for instance. We spend a lot of time talking about technologies like Nominatim, iD, osm-carto, OverpassAPI, etc, but if we can find a way to spend more time talking about Sarah Hoffman, Bryan Housel, Mateusz Konieczny, Roland Olbricht, Grant Slater and Tom Hughes, this not only gives them some much-deserved kudos, but it makes the story more interesting somehow. In our open community we miss out a bit on this by being so egalitarian, altruistic, and just plain over-modest all the time!

Other fantastic efforts which create a human interest story include the Belgian community’s “Mapper of the month interviews”, and the OpenCageData interviews. I’m a huge fan of those. Again, it’s a thing I pondered about doing but never got off my ass and did it. I think we need to weave a bit of this good stuff into the blog.openstreetamp.org somehow.

In fact thinking about doing things on blog.openstreetmap.org (and generally not doing them) has put me in a state of analysis paralysis lately. My stream-of-conciousness diary entries dried up, and so I’m also rather embarrassed to be nominated for an award for a thing which I’ve stopped doing!

Of course I also have a new and exciting time sink these days, but I am allowed a few days off from nappy changing to head to State Of The Map Brussels (arriving tonight). I’m looking forward to this immensely. Maybe I’ll get into some interesting conversations with belgian beer! If you like my diary entries, maybe I’ll write up some of these conversations. There we go… it’s motivating people already!

Long Names of OpenStreetMap

Posted by Harry Wood on 31 August 2016 in English. Last updated on 1 August 2019.

Check out this thing which I just got working again:

>>> Long Names of OpenStreetMap <<<

So that’s elements with a name tag, where the name seems to be very long. It’s a full list of the longest names in the planet (>150 chars)

I just found this old code and dusted it off. I made it originally back in May 2010 when Richard Weait ran a “Project of the week” looking at long names. I called it “namecheck” at the time, but I’m renaming it “longnames”.

A crazy long name is probably a data bug to be fixed. It certainly looks like a bug when we try to render it.

flickr

But… well taking that example. Here we have a few university buildings, each with a name, which list several departments. Can we class this as wrong? I think so, yes, but I’ll have to make a hand-wavy non-scientific judgement: I’d say it ceases to be a name of the building and becomes more of a “description” when it gets that long…. in this case. And maybe that’s a problem for a lot of them.

But in general this is not going to be a clear case of “these are all bugs. Here’s how to fix them”. Because of that I think I would stop short of saying this could be a MapRoulette challenge, or a new class of bugs for KeepRight or Osmose. For the moment I’m just going to put this list out there, and suggest some careful interpretation (but feel free to suggest other actions / tagging policies in the comments)

On the other hand some of these definitely are bugs with clear fixes. I saw somebody adding a load of space characters and then repeating the name again within the name tag, presumably in attempt to control label placement on a road (Yeah no we don’t do that)

The other caveat, in case it wasn’t clear, the username listed there is ‘last editing user’. It’s not necessarily the person who added the very long name, but it is a person who didn’t fix it :-) That and the last edit timestamp are really just to see if there’s any interesting patterns in the list.

My planet crunching script to find long names is here along with SQLite, CSV, and mangled OSM XML output files. I will re-run it again in a week, but the display also has a (slightly odd) feature to let you “rescan” an element after you’ve made a fix.

[Update: I mentioned “feel free to suggest other actions / tagging policies in the comments”. But also this discussion on the wiki might be a good place to discuss debate what the policies should be]

[Update: New diary entry. Updated data for 2019]

Tree named pubs of London

Posted by Harry Wood on 30 May 2016 in English. Last updated on 1 June 2016.

It’s London Tree Week. I saw someone tweeting at OSMLondon asking “Can you help identify tree named pubs In London?”. Why yes I believe we can! We’ve always specialised in pubs. We even used to have a tree named pub “The Mulberry Bush” as one of our OSMLondon regulars.

This seemed like fun, so I went ahead and did it. Here’s the tree-named pubs of London on a map.

screenshot

My method was maybe a bit old these days. See this bash script which fetches the London metro extract, uses osmosis to get pub nodes, then pub ways, then merge pub ways and nodes, then uses osmconvert to get centroids on the ways, then convert to CSV. Then grep to filter ‘Bush’, ‘bush’, ‘Tree’ and tree’ (but not ‘Street’) [Update: I’m now also finding tree type names. See comments below], to result in treepubs.csv. After that I fiddled with the CSV to make it a javascript array, and loaded that into my leaflet marker array example, and loaded in the treepubs as markers. Job done.

I found that to be the easiest way to do it, having done similar things before (This old blog post describes similar osmosis/osmconvert steps for example) …but there’s probably many different much easier ways of pulling up a map of tree-named pubs in London (or at least getting as far as the csv output). So that’s an exercise for the reader.

I’m quite sure we should be able to do a single Overpass API query to get the pubs of London (as centroids for ways).

I once saw a talk by people from Tableau (GIS software) Visualising the Great British Pub with OpenStreetMap data and Tableau which was all about mapping pub names. They could get it done that way for sure.

Pub names are always fun, but we should probably look to do something more directly related to London Tree Week. We have a lot of trees mapped in London. Maybe we should visualise this. Make a dedicated tree mapping app or something. No doubt London’s tree data is still skewed towards Southwark where we’ve got them all imported. Tree mapping party anyone?

Mapillarising Brazil

Posted by Harry Wood on 15 May 2016 in English. Last updated on 17 May 2016.

For years I’ve been meaning to try out Mapillary properly, but my phone is broken and can’t connect to wifi, so no upload.

But this was another thing I got to do while on holiday in Brazil. I persuaded my wife to install mapillary on her phone, and we mapillarised while we were driving around her home city of Guarulhos. She’s pretty bored of all this mapping stuff, but likes to keep me entertained while we’re in Brazil, and maybe she likes the idea of mapping her home town too. So we got lots of photos around these colourful Brazilian streets.

flickr

Also while going on a trip to the seaside, but sadly I don’t think I got much of a seaside view in any mapillary photos. Some are quite nice and jungly though

flickr

And on the way there my wife wasn’t amused when we got massively detoured in a drive around the city of Mogi das Cruzes. It was only semi-deliberate :-)

On the site you can see what proportion of streets have coverage (green) on a map display like this. I guess Mapillary coverage is expanding, but there’s a long way to go. Hopelessly incomplete… but maybe if enough people join in, we’ll have street-level photos of every street in the world. It feels like exploration. Conquering the territory, or laying the first tracks to form a skeleton that others will build upon. It feels like the early days of OpenStreetMap.

I was impressed by the ease of photo data gathering with the app. It’s a very passive process but the app gives satisfying flashing counter as it gets photos. It detects when you stop moving and stops taking photos. The messages makes it nice and clear what’s going on.

We were driving. I’m not sure how well it works with pedestrian tracing. By fortuitous coincidence, I was gathering up freebies at SmarterTravel Live conference, a few days before heading to Brazil, and one of the freebies (courtesy of dat mobility. Thanks!) was this simple windscreen mounting sucker thing. Perfect for mapillary tracing!

flickr

I was also impressed by the ease of upload. (Given a wifi connection) it’s very simple to upload this quite hefty amount of data to the mapillary servers. There’s then a delay while mapillary crunches the data before you see your green line on the map. I notice there’s then a further delay before the images get stitched together with the animated zoomey effect. Understandably because it’s a huge amount of processing, which no doubt gets queued up along with everyone else’s collections of hundreds of photos.

But what about using Mapillary for contributing to OpenStreetMap? When pondering OpenStreetMap workflows, I see a sliding scale of more or less passive data collection. Mapillary is hugely passive, which is great news when it comes to quick effortless surveying, but the flip-side of that is, you leave a lot of work to do later on when you’re back at the computer. I did a bit of this last night. Looking through the places we’d been driving around Guarulhos, clicking around with the mapillary JOSM plugin. Click next photo -> next photo -> next photo, which is essentially like driving along the road all over again, but this time I’m scrutinising the photos for anything I can add to the map. Probably a lot slower than the drive itself (depending on how much stuff you see which needs adding). In other words, after all that very simple passive surveying, I’ve left a lot of work to do later. A hopeless amount really

Being in Brazil my photos are all super-sharp in the harsh sunshine, however I found it pretty hard to identify Brazilian highstreet shops. In the more shabby areas the shops are not clearly branded or labelled (akin to the shabby north London shops all around me), and I often looked at translating a shop sign which turned out to be a billboard/product advert. Slow going, and I probably won’t get around to examining all my Brazil mapillary traces for data to add to OSM.

But being shared with everybody, a mapillary trace is a resource which has the potential to be super-useful for other OpenStreetMappers. I’ve already used other people’s mapillary traces in London on a few occasions e.g. puzzling over particular data problems from notes or other QA tools. But mostly I’ve found myself wishing there was more mapillary coverage. When we get to the point where we can back-up all of our data fixing with both aerial imagery and street-level photos, Mapillary will be quite something! …might have to borrow my wife’s phone!

School Edit Tracker

Posted by Harry Wood on 28 April 2016 in English.

The “UK quarterly project” for the start of this year, was about schools. It was pretty popular and quite a few mappers got involved in editing and fixing up schools data in the UK. How many? Well…

I fired up my old “edit tracker” code to track School edits during the first quarter, and now it’s frozen as a record. So we can see 362 people did a total of 15548 edits to UK schools data during the quarter.

And here’s the rankings, showing that Robert Whittaker takes first prize with 1339 edits. The rankings also show a classic long tail curve. Not too uneven, but still with almost half of our 362 people only making a single school edit. But that’s OK. Getting lots of people chipping in a little bit is a good thing.

That’s why I created a new display called “New Starters”. I hoped this might get people interested in the challenge of how to spread the word and get more people joining in.

Linked from there, and from the rankings, I made another new display for each user. So here’s the school edits for the ‘Harry Wood’ user for example. We can see edits over time, so we can see my rather meagre contribution. We can also see that Robert Whitaker had a spurt of activity towards the end, while Yorvik Prestigitator seemed to take a break at the end, (and actually this allowed Robert to sneak ahead and take the top spot!)

screenshot

This involved a bit of drawing of bar charts in javascript. Last time I did something like this, I generated static images using google charts API, but this time I wanted the interactive mouse-over effect which we see with so many web charting libraries these days. I just had to find a free open source one… which presented quite a big sorting the wheat from the chaff challenge. I chose c3.js, which was quite easy to get working for this. Sometimes the width of my bars goes a bit wrong. Look at the way they overlap on the this chart for example. Maybe someone can spot what I’ve done wrong. The source code for all this display logic is on github.

Behind the scenes, there’s my “diffreader” logic. As the name suggests, it reads the diffs (OpenStreetMap minutely diffs) Some ruby, a bash script, and sticky-tape, doing all the fuddling around with diff files, sequence files, parsing XML badly (really badly Naughty Harry), and eventually writing a nice SQLite DB file full of school edits meta-data. That’s all unchanged from back in the days of wimbledon edit tracking, and the Big Baseball project, but one big thing I had to add was the ability to isolate UK edits. Easier said than done because the diff XML will sometimes contain nodes, which have latitude and longitude… sometimes not. I think if you edit a school by only changing its tags, then it doesn’t. So I had to make some other calls in some circumstances, hold onto some data which was read in from earlier in the file, and generally apply more sticky-tape to my code. …Quite a lot of hassle just to decide if an edit is in the UK.

It all works pretty well though. I was hoping to point people at it a bit more (tweet about it etc) to whip up some competitive excitement in the closing few days of Q1 …but then I was busy on a beach in Brazil :-) Actually I don’t have a way to stop it automatically, so I had to remember to shut down the cron job at midnight UK time on March 31st, but as it happened I was also busy online getting an april fools blog post put together at the time!

The “UK Quarterly Project” is a thing the mappa-mercia guys have been running for quite a while now on their blog. I think Brian Prangle has been the main man behind them. There’s been quite a few. I rejiggled the ‘UK quarterly project’ wiki page to list them all. But I think after all the excitement of editing schools, we’ve not announced a topic for Q2 yet (unless I missed it). I’m keen to see if it will be something I should unleash this edit tracker tool on again.