OpenStreetMap

InfosReseaux's Diary

Recent diary entries

Generalize OSM tagging model awareness and usage

Posted by InfosReseaux on 22 June 2023 in English. Last updated on 2 July 2023.

Hello everybody

OSM Tagging model is a unique piece of knowledge and its usage could be discussed more widely, even outside of OSM.
Recent announcement of Overture Maps Foundation data schema will challenge us shortly. I’ve been involved in tagging improvement for more than 10 years and I now believe a lot in its more general usefulness, even outside of OSM.
It’s time to find how making it obvious.

First of all, tagging is a core component of OSM project and will remain as this in the future, the point isn’t to split mapping and tagging appart.
However, our tagging model could inspire (or already inspires actually) many data managers operating data bases outside of OSM.
A lack of consistency, versatility and even relevancy are sometimes noted about many data sets we can be using in general. They are at least missing some uniformity while some of them describe the exact same objects despite coming from different producers.

The more we have data, the more we need to standardize their structures.
OSM actually have the advantage to be built over a single namespace and force contributors to maintain consistency between very different concepts. It’s not an usual practice, there isn’t so much databases that gather buildings, roads, trees and utility networks in the same place.
Time spent to document tagging is now a significant force to make our semantics usable even outside of OSM.
It’s not necessary to import private databases in OSM nor use OSM tools to get benefit from usage of provided tagging, if applicable.
Developing tagging is not necessary a call to mapping or an attempt to make a given contribution mandatory. It’s also an exercice which demonstrates every day the versatility of OSM semantics and creativity of involved contributors.

In France, we already began to build strategic bridges between OSM tagging and business standards or government standards in order to make things interoperable.

Such connections are expected to reinforce worldwide in coming years.

Increasing interests about OSM tagging, just like OSM data, are concerning to protect them both at the appropriate extent. The point is to allow the most valuable usages while preserving contributors involvement.
The topic is now central since Overture Maps has announced its own data schema based upon OSM. As the OSM wiki licence regulates documentation usage, how could we regulate and protect usage of the tagging model itself?
Nothing looks more like a group of field names than another group of field names.
Except a few iconic syntaxes like opening_hours, has OSM tagging got enough originality to deserve a protection?

This post is intended to raise such concerns and improve awareness about importance of tagging, at least as important as data itself.

French version available here

OpenStreetMap for hydropower

Posted by InfosReseaux on 23 December 2022 in English.

Hydropower mapping and render in French Pyrénées mountains

Water management and power infrastructure had made me busy here for years. Hydropower infrastructure intersects them both.

A new wikipage has been published about that (and waits to be improved) : https://wiki.openstreetmap.org/wiki/Power_generation/Hydropower

It’s not only about dams, power houses but about waterways as well, and OSM tagging model has been continuously developing to describe this. Water management will be more and more important in coming years to tackle droughts and fair water access challenges. Constantly seeking new ways to produce power and store water require accurate data and objectivity.

As hydro mapping and tagging improves on every continent, a more robust documentation on that particular topic may now be useful.

You will probably read it as a complement of existing waterways and water management pages.

Hydrology is another really thrilling topic to map in OSM, and it’s highly satisfying to see the water network becoming more and more routable and connected to natural waterways.

You can browse a render showing that kind of features in France here: https://map.infos-reseaux.com/#10.28/42.865/-0.1268/L,W

Feel free to share some personal experience about water management in comments

Starting January 2021, Enedis and OpenStreetMap France, OSMF French local chapter, entered together into a 3 years term partnership. It’s a significant step forward for data exchange and collaboration between OpenStreetMap community and utilities companies. Enedis started to publish some of its data under an open data Licence back in 2015 and now wished to ally to a well-known project like OSM to encourage crowdsourcing in a virtuous way.

Enedis operates the public electricity distribution network of 95% of Metropolitan France. It was the first European distribution system operator to get involved in open data by sharing useful assets for environmental transition and public service. Sharing its network cartography is particularly useful for OSM community since 2018.

This partnership is part of Enedis 2020-2025 Industrial strategy and as well in OSM France strategic roadmap to improve OSM usage and institutional contribution.

Partnership as a win-win solution

According to this partnership terms and conditions, Enedis agreed to provide more open data related to its operated infrastructure and aerial imagery at 5-cm resolution scale produced on a part of Metropolitan France over surroundings of power distribution grid. These pieces of imagery will be dedicated to OSM contribution only and will be usable as background in most of existing editors (JOSM, iD, …). This will serve common business topics shared by both Enedis and OSM France such as * Overhead power poles and lines mapping * Comprehensive surface power street cabinets inventory * Up to 4 other topics could be defined during this 3-years term.

As a legit return, OSM France will be in charge to maintain thematic data extractions from OSM. Those extractions will be released as OdBL material and be used by anyone including Enedis with all due respect to the License Terms. Mappers will be encouraged to contribute spontaneously on selected topics. Obviously no fixed objectives has been defined as to remain on a volunteering basis.

As a result, mapping community will get access to higher quality aerial imagery and useful open data to improve OpenStreetMap where it needs to. Enedis will get access to ground qualified data and will be able to plan maintenance or power grid development works with even more precise knowledge.

Exchanged data doesn’t include any commercial or personal material and this partnership won’t encourage bulk import in OSM. No directed mapping activity is defined for now and will be described on Enedis wikipage if necessary.

A balanced collaboration

Power networks mapping is activity that require precision and is increasingly governed by law and regulation. It gets OSM community busy from the very beginning. This partnership will encourage practical discussions between Enedis cartography staff and OSM community as to share about practices from two universes that didn’t get used to be connected before. That will certainly leads to stronger links between data models and data management practices.

Here is a sample of 5-cm resolution imagery produced by French IGN Power transformer

Open contribution dashboards

A dedicated ProjetDuMois instance has been setup to get dashboards about encouraged contribution on topic listed upside. Several millions of features remains to be mapped like 11 millions of power poles and dozen of thousand of kilometers of overhead power lines.

Let’s get in touch on https://enedis.openstreetmap.fr (currently under planned maintenance)

You’ll see there that some topics already got a great start at the very beginning of 2021 Enedis dashboard

As any classic ProjetDuMois project, an integrated editor is available there and combine aerial imagery background, existing power grid network layer as to ease contribution. Integrated editor

It thrills me to see how OSM attracts more and more attention of professionals and is now included in many public services strategies. Hope to see equivalent initiatives raising in coming months !

See also

Location: Roi des Bois, Franchesse, Moulins, Allier, Auvergne-Rhône-Alpes, Metropolitan France, 03160, France

Pumps tagging proposal

Posted by InfosReseaux on 22 November 2020 in English.

Pumps cartography is useful in many ways in OSM and currently practiced around water wells. It’s possible to use the pump=* key to state for a pump availability on a given well only. The key actually refers to the pump drivers, a motor or a lever to manually move the pump.
It’s an important information as to know if you’ll be able to get water with or without physical effort.
For instance, it’s not yet possible to make a significant distinction between pumps running on electricity or gasoline engines among other possibilities.

Pumps are obvious but complex devices. Wikipedia already provides a comprehensive classification with up to 15 different kinds.

Each design have different capabilities and can be driven by numerous different drivers. OSM could get benefits from encouraging mappers to complete such detailed information with appropriate tags if they are knowledgeable to do so.
It’s clear that such information will help crisis management or emergency rescue teams to restore water supply if and only if they have appropriate generators or engines. Coming around a gasoline powered pump with a solar panel won’t help.
People themselves could be interested in case they have to bring their own material to get water.

A water well in Mali operating with manual piston pump A water well in Mali operating with manual piston pump. It’s proposed to use this new tagging, on a node :

  • man_made=water_well (it’s a water well)
  • pump=piston (pumping up & down with the lever means it’s a piston pump)
  • mechanical_driver=manual
  • handle=lever

Currently, using word ‘‘pump’’ to deal with actual drivers could be confusing and worth a try to change toward a more appropriate terminology.
It’s an opportunity to allow pump mapping in many more situations than water wells. Current pump=* really focuses on water wells only.
Ability to make a distinction between manual and powered pumps is still possible depending on knowledge level of mappers, using mechanical_driver=powered if necessary.

Here it is a proposal started in early 2020 and now open to vote; It was designed with wikipedia classification in mind

Power network digital twin Following a published article months ago, French OpenStreetMap community reached a step in the beginning of 2020 regarding cartography of highest voltage levels, 400kV and 225kV, power networks.

Contributors had been busy, providing valuable and detailed data for years since 2008 in many places in France. This now enables to assemble this knowledge to provide an elaborated digital twin of French power transmission network including routing capacities to get paths followed by electricity over networks. It is hard to reflect years along people engagement in a single article, but all of this has been a singular human collaboration for which we should be thankful.

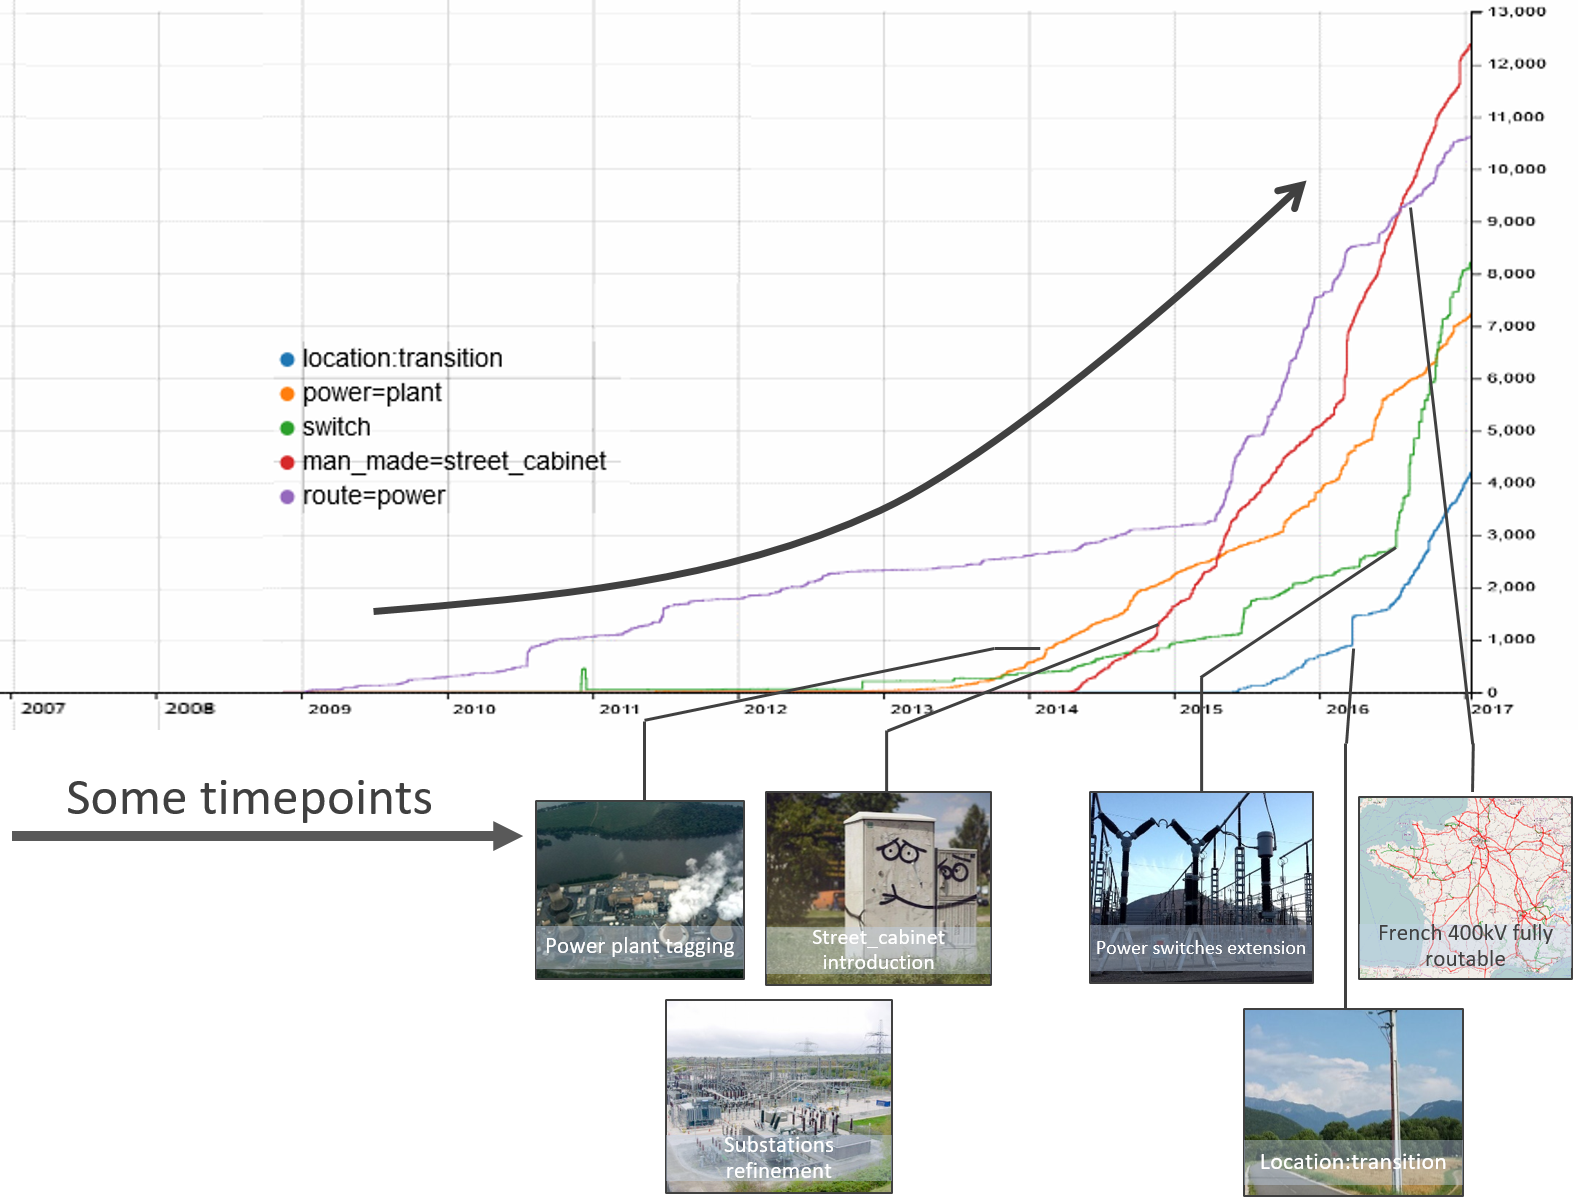
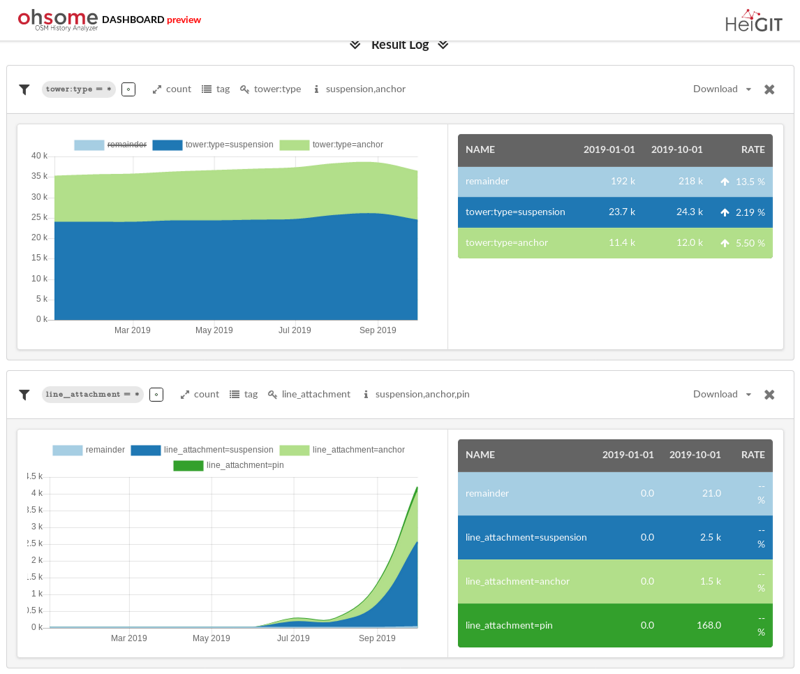
OpenStreetMap has been continuously updating its tagging model to describe multiple objects on the ground including power networks. Propose and describe useful tagging to follow mapping contribution has been done since the beginning back in 2004. Such proposals and tagging experiments clearly enable consistent and usable mapping contribution from ground or aerial imagery just like in any other OSM knowledge domain.

Power networks data allows to improve operational efficiency (power routing just like road routing, consolidate ground surveys…) and can improve reliability of planning and development studies by combining environmental and surrounding data on the same platform. Climatic sensibility of overhead lines can be evaluated more quickly with help of landuse data in OpenStreetMap for instance. Some 3D-renders like F4-map also use existing power lines to display them in landscape.

Physical description

Power networks are composed of lines and sites to allow electricity to flows between production and consumption places. Most of their components are visible on ground and are worth be added in OpenStreetMap. Contributors has not only described overhead lines but substations as well with many equipment to switch or transform electricity.

Power substation renders 
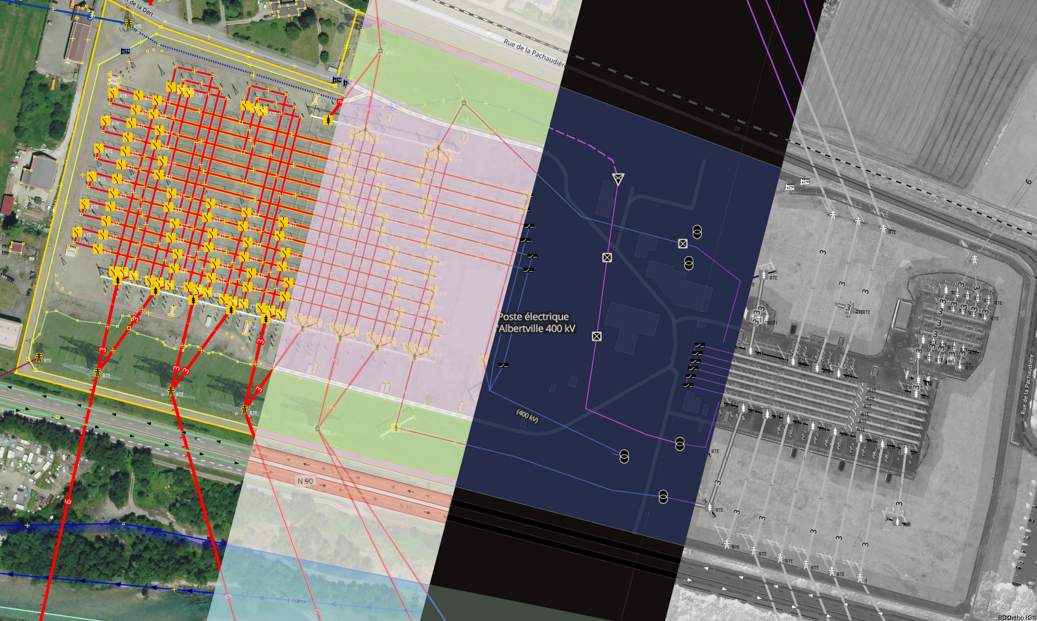
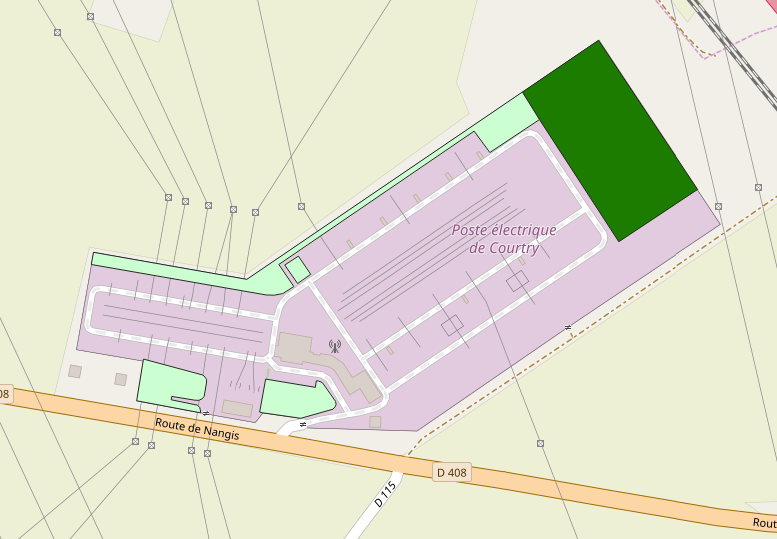
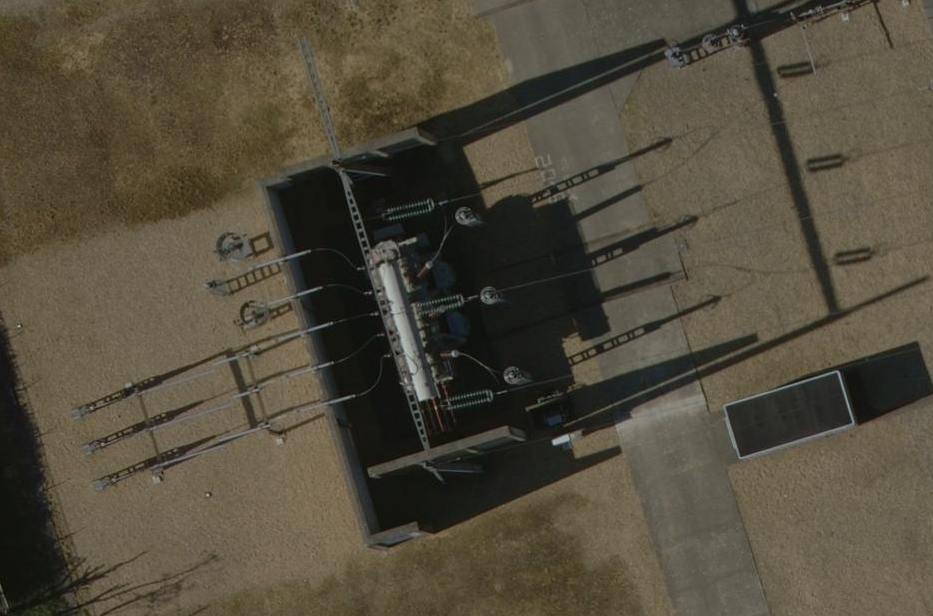
Instead of a simple drawing of lines converging to simple nodes representing substations, we wish to describe what is inside facilities like upside in La Vaupaliere near Rouen. Thus it’s more than 389 km of busbars operating at 400 kV or 225 kV which has been drawn since 2013 and 194 km of portals to anchor incoming lines.

Far from 35 200 km of power lines, 1 550 underground cables, OpenStreetMap now contains (situation in April 2020)

  • 7 690 disconnector switches
  • 3 185 circuit breaker switches
  • 300 400kV transformers
  • 955 225kV transformers

Contributions has been made first of all from Bing imagery, local orthophotography and more recently with French Geography Institute’s BD Ortho imagery. The last has been made possible trough a recent agreement signed between Institute and OSM France and was undoubtedly useful to complete power networks mapping.

Furthermore, open data has been published in 2017 by French network operator RTE including overhead lines, underground cables and supporting towers. It has been provided on the national transmission networks platform gathering participation of 8 industrial private actors. Those data allowed to know since 2017 where the finish line was and get a more accurate description of underground parts of the network.

Power quality control in Osmose 
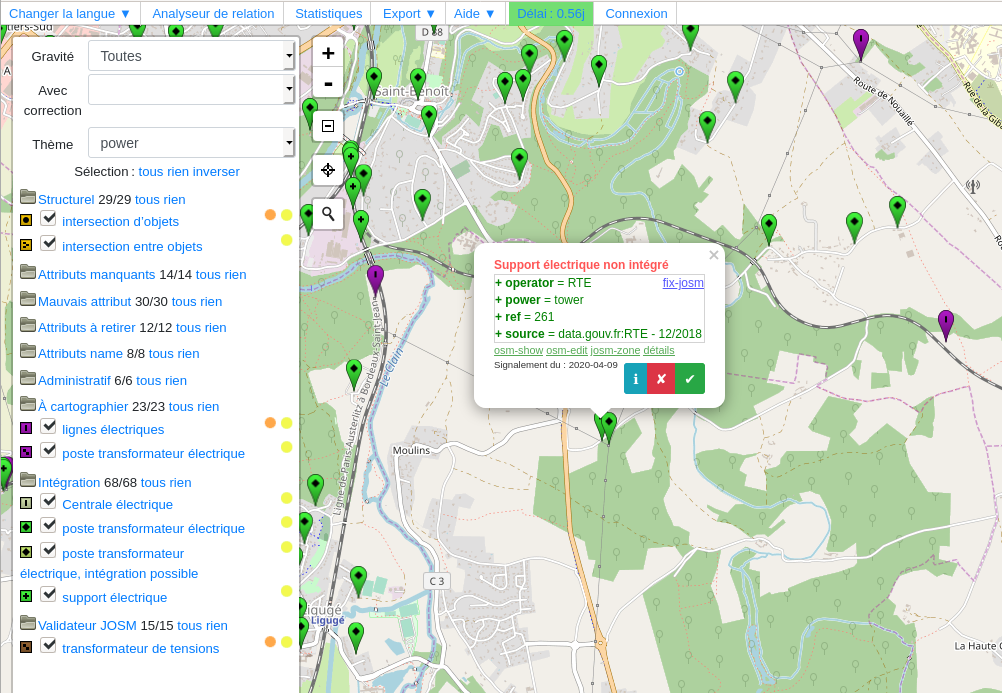
Official data were added to quality control tools like Osmose to guide contributors. Lacking features areas were shown like many other domains in OSM. A dozen of different analysis show topology problems, missing integrations and tagging mistakes.

Simplify geometries

Topological capabilities of OSM databases allowed to simplify some official data provided by network operators when it was relevant to do so. When several underground cables were buried in the same time, a single OSM line with appropriate attributes can be as useful as many. Power vectors simplification 
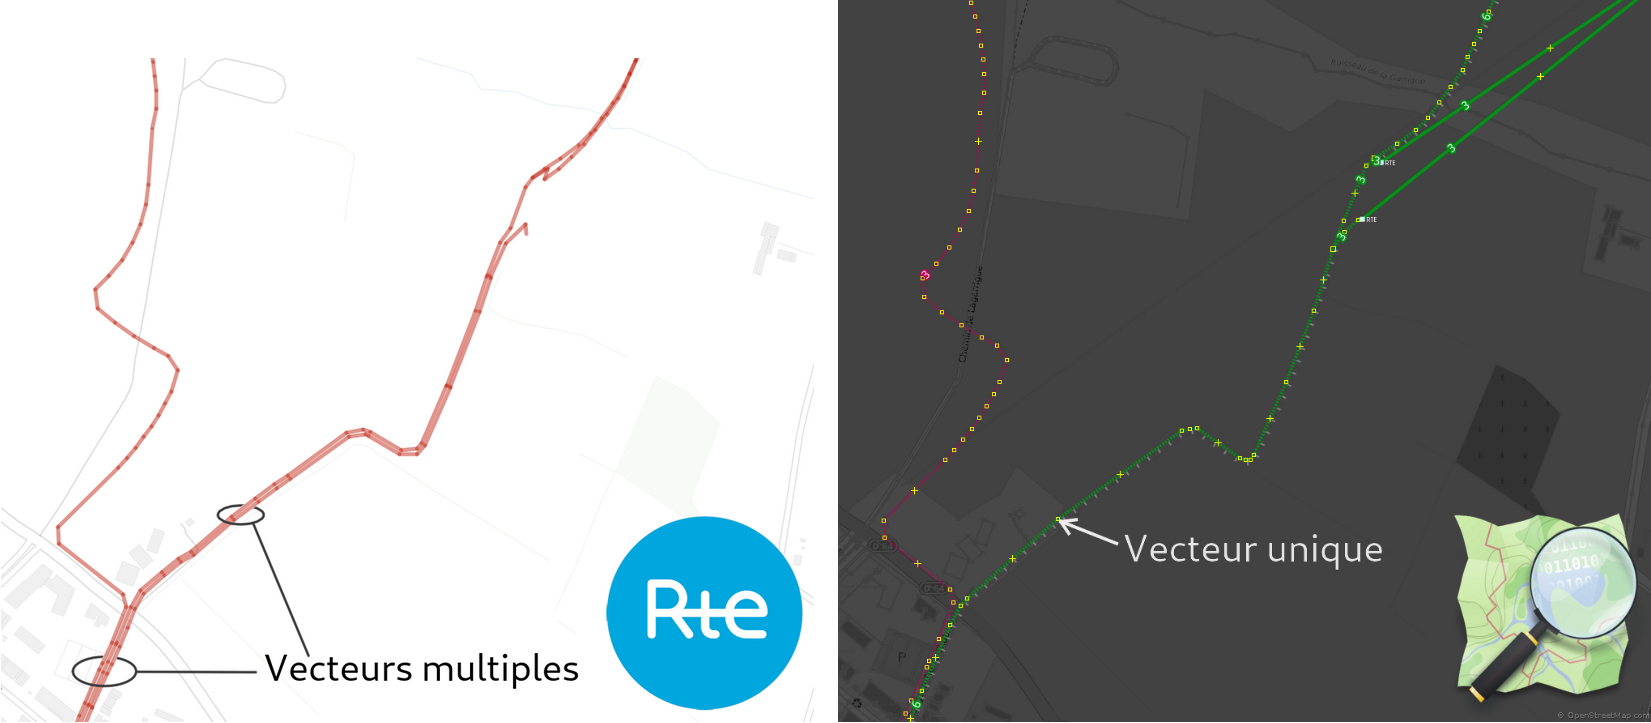
Same information are available in the two approaches. Limit amount of geometries in OSM allows to reduce risks of collision with surface features in further editions.

230 km of vectors were simplifies this way until now and this is still counting.

Logical description

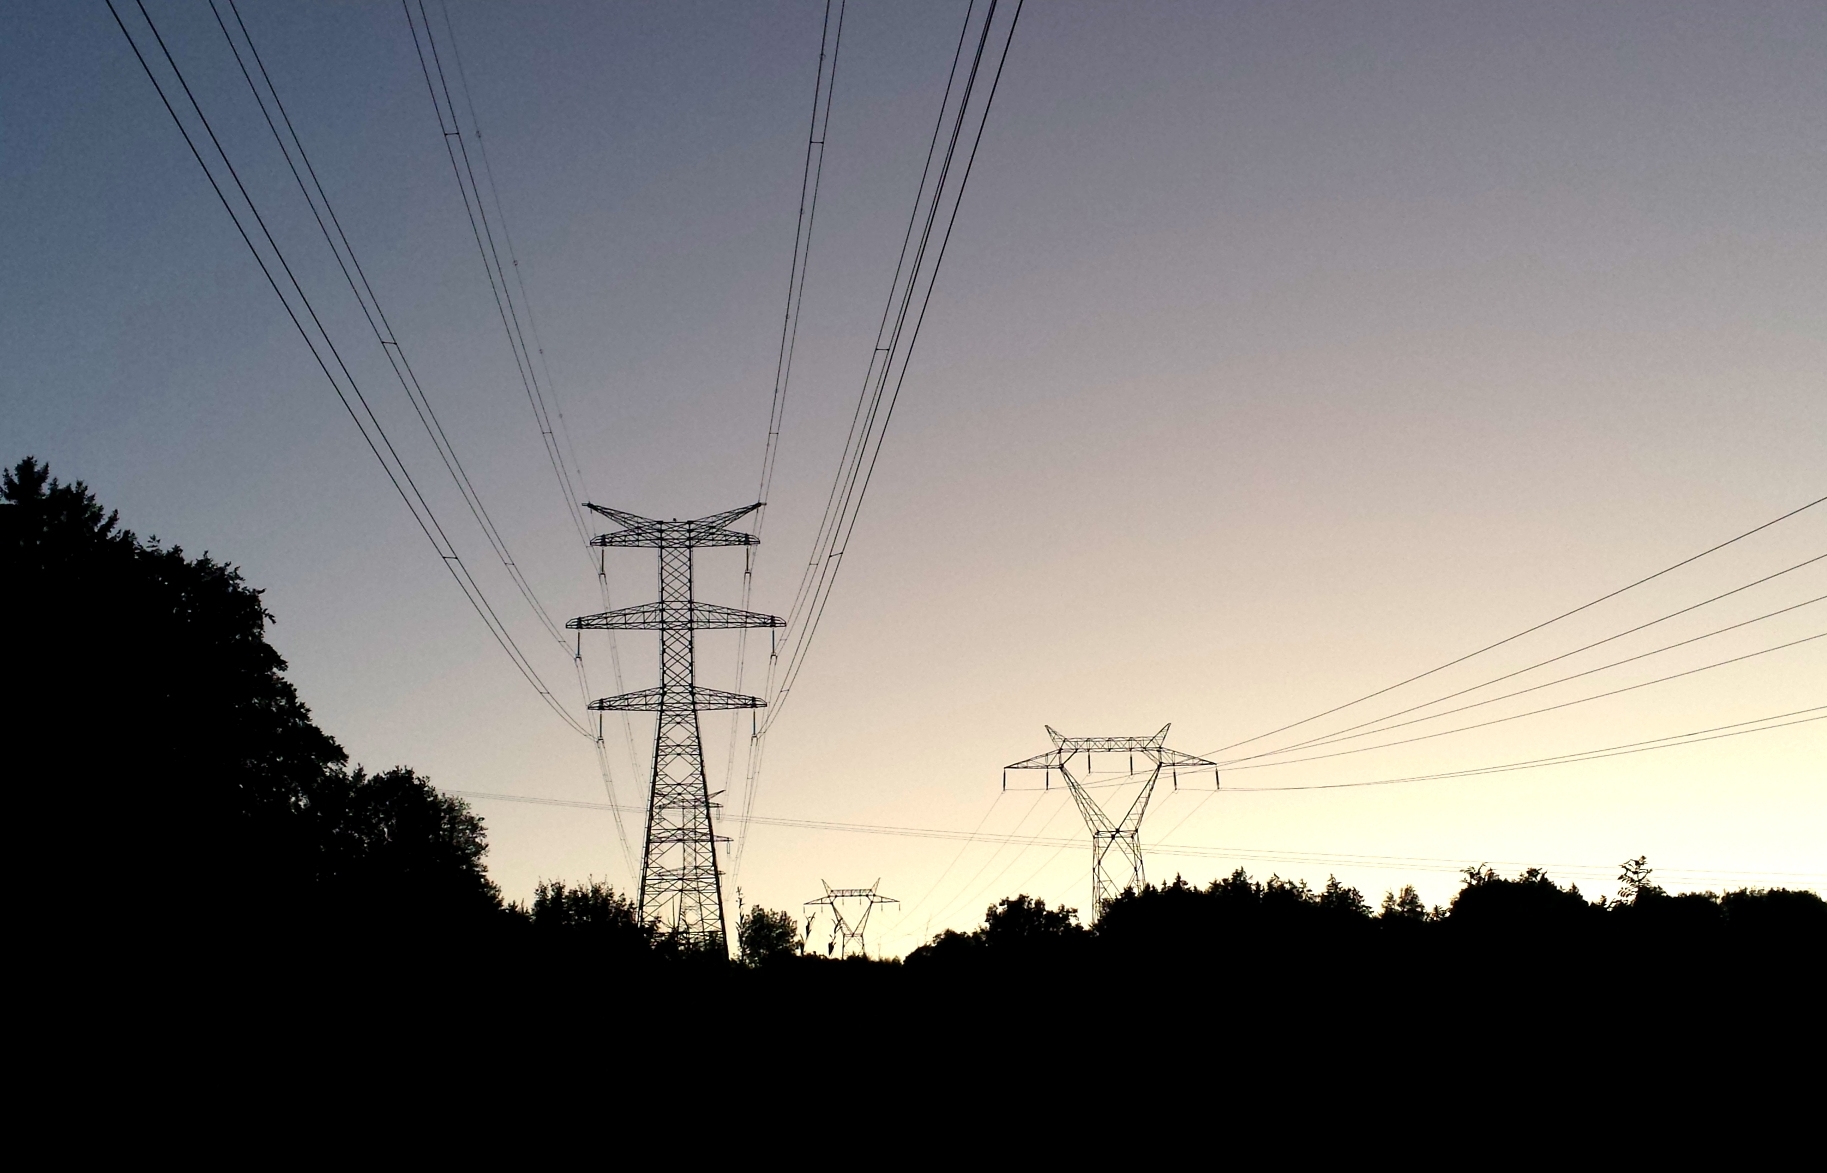
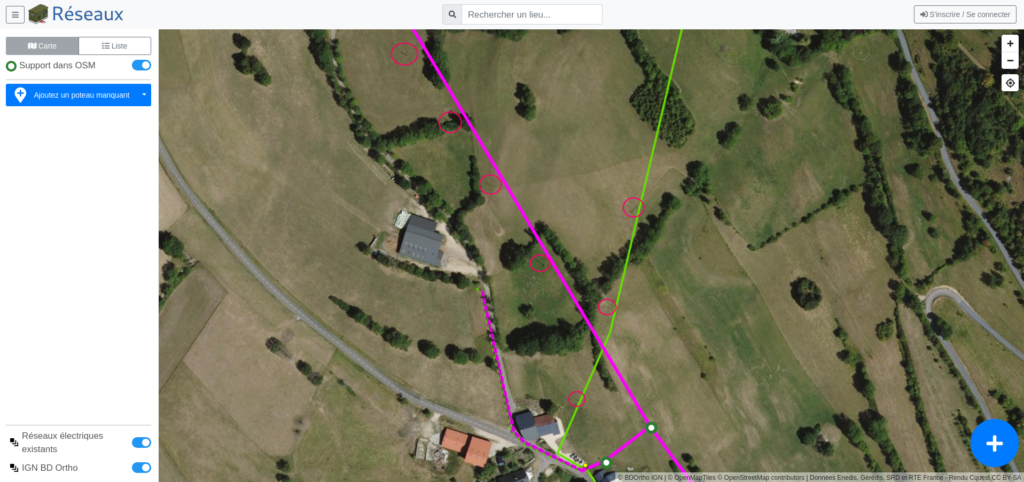
Knowledge of overhead lines and underground cables isn’t enough to get paths followed by power. Some lines may carry several independent circuits. Circuits are power systems (composed of 3 conductors in most alternative networks) linking 2 or more network substations. Picture below shows lines carrying 2 circuits each while their own OSM geometry consists in a single line. Double circuits power lines

Starting 2015, logical relations where established and involved substations and linking power lines sections between them. Each relation represents a single power path in the network just like it’s done in public transportation with underground or buses lines.

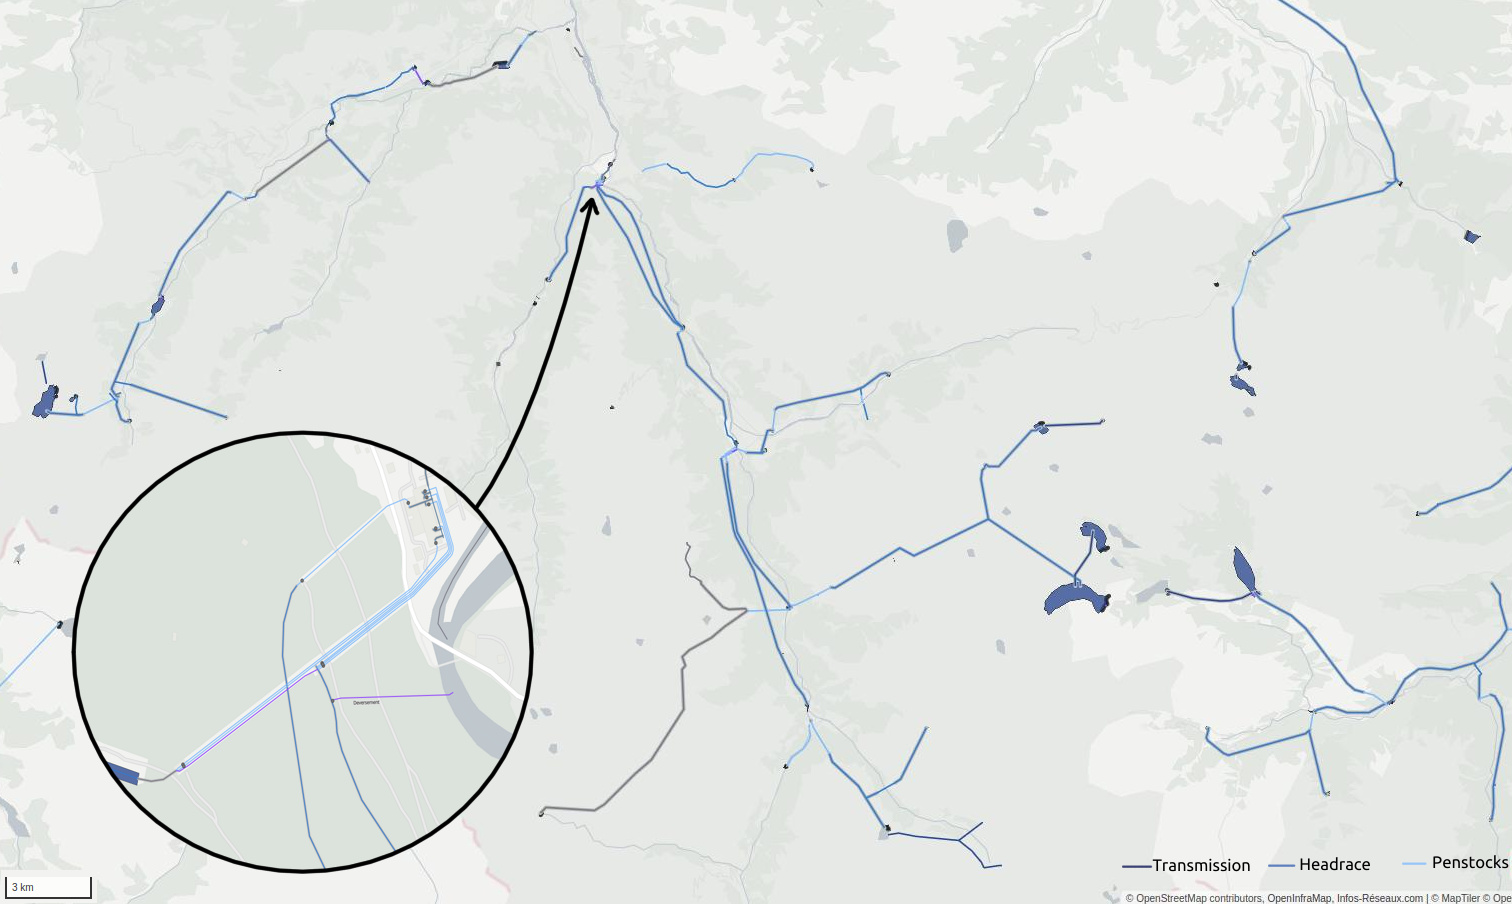
Currently, more than 1 500 relations are available in France. This materialize an original digital twin of 400 kV or 225 kV transmission networks on which it is possible to simulate power flows or incidents impact with help of technical data, algorithms and dynamic data available in other communities.

Render got with Overpass-API querying power relations in Metropolitan France 
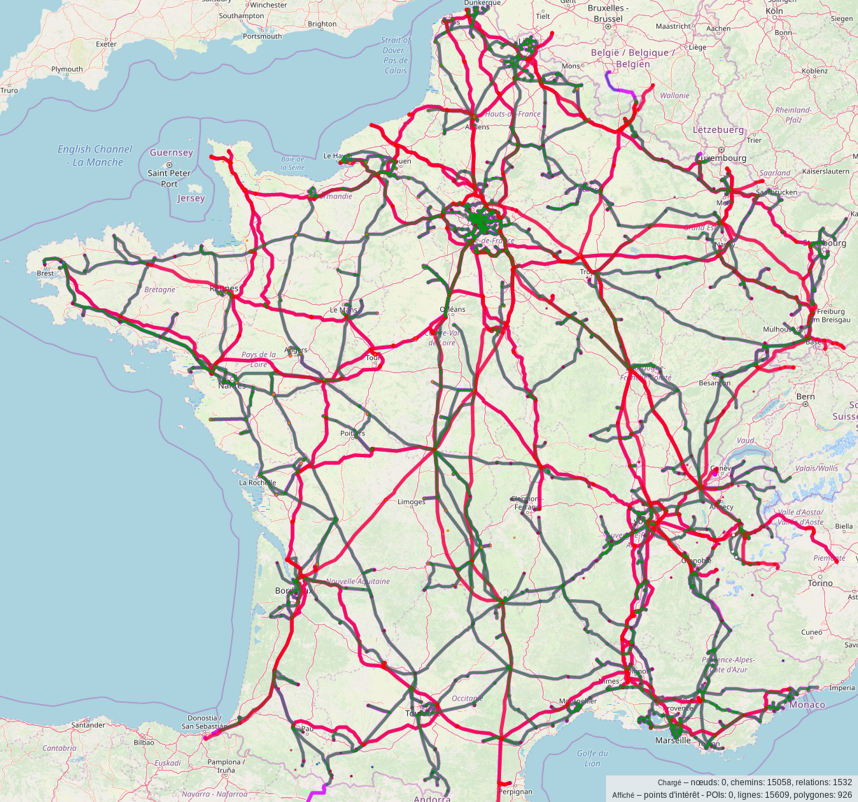
An overpass query retrieves these relations for you to obtain this map

360° data

Describe technical equipments inside outdoor industrial sites like many power substations is a unique occasion to add usual OSM features as well.

Starting 2008 until now, following features has been collected (situation in April 2020)

  • 523 km of private service roads
  • 422.3 hectares of grassland and 10 hectares of forests
  • 450 trees
  • 46 km of internal walls including fire walls (between transformers)
  • 273 km of surrounding fences (excluding double fences) and 201 km of surrounding walls

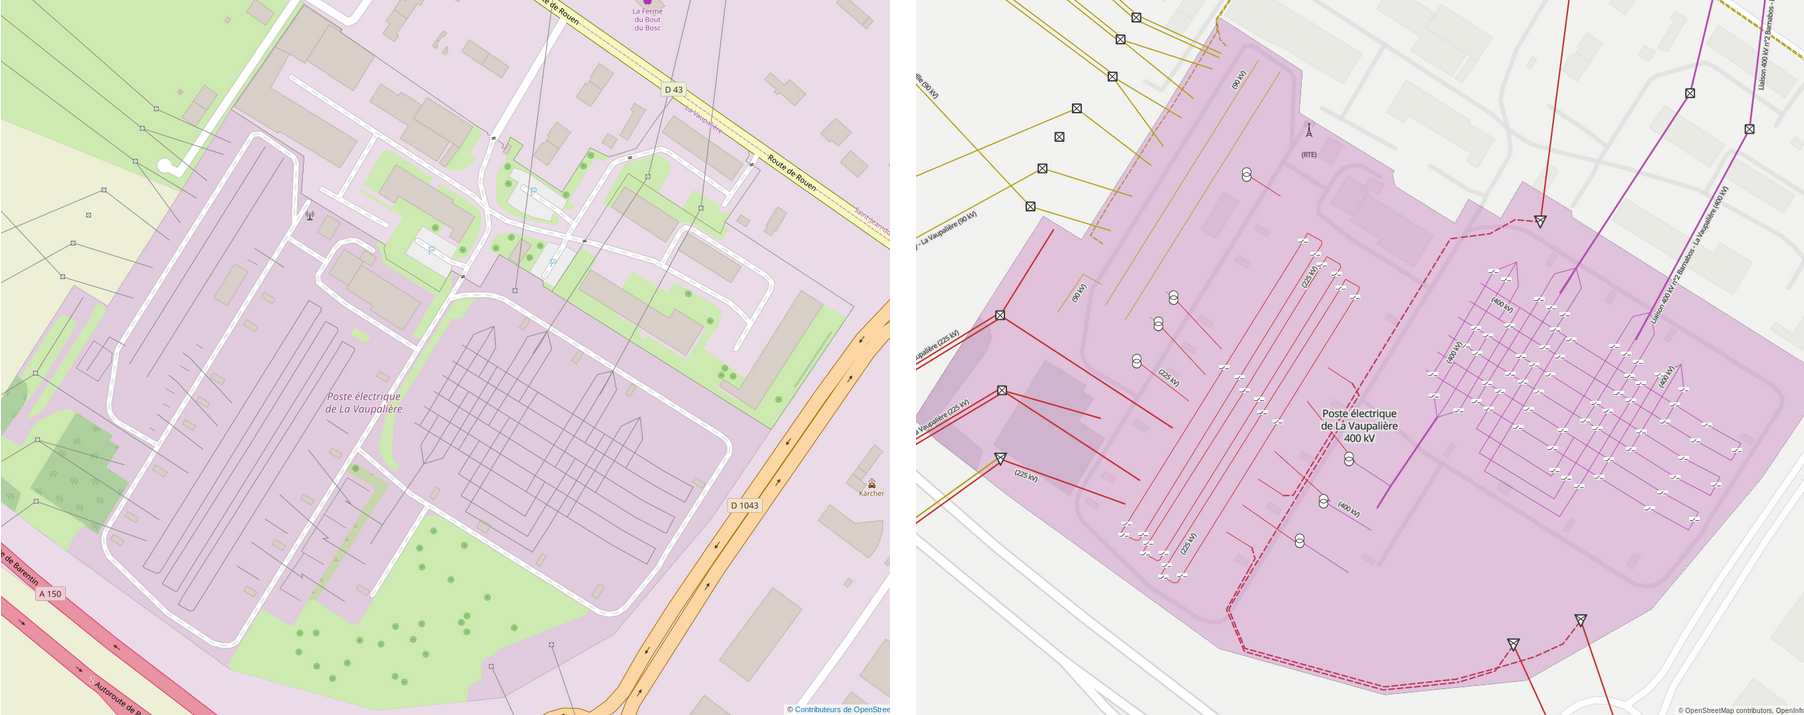
Some example of remarkably green substations like Creney and Vaupaliere are particularly representative of this achievement.

Vegetation details

Vegetation mapping inside substations is important in regard of some environmental-friendly projects to reduce use of chemicals on which operators communicate sometimes. OpenStreetMap now provides a green landuse classification inside substations including grass areas, forests and scrubs with the established tagging everyone uses outside.

Vegetation in Courty power substation

Complete surface of 400 kV and 225 kV substations raises at 2 571 hectares in metropolitan France. We found out that 16% of this surface is covered with grass, which means 422.3 hectares were outlined by hand, year after year since 2008.

Further outlook

Produced data were already extracted and published on the French national open data platform Data.gouv. Several datasets describe network components which can be used in an external GIS with all due respect to ODbL licence terms. They extend existing official datasets provided by network operators back in 2017. You’ll find among them:

It’s also possible to make custom extractions with Overpass tool in the appropriate language.

Note that OpenInfraMap.org website renders usually hidden infrastructures including power networks in OpenStreetMap.

OSM still needs data to go on

Even if provided content is already significant, OSM still improve its tagging model and proposals will continue to be written. Additional official data would allow community to produce even more rich datasets with more and more features. Regarding static characteristics of networks, we think those information could be helpful:

  • Power towers dimensions and characteristics
  • Rating and static properties of power transformers
  • Properties of power switches
  • Compensation equipments figures and technologies

Several years has been spent across country to discover those infrastructures, took thousand of pictures and make surveys on my spare time. This is not a professional activity. Gathering such information on a single platform will certainly be useful to a better understanding of how these networks run. Topic about risks prevention and crisis management can now be explored. Anyway it is now possible to compare technical data and surrounding environmental features which is barely possible elsewhere.

Finally, French contributors will be able to continue to contribute on lowest voltage levels in transmission and distribution networks. Digital twins of <100 kV networks remain to be built and this will be a as tremendous as those networks span everywhere. Feel free to join us in your own location.

François Lacombe / @InfosReseaux
All pictures under CC BY-SA 4.0 licence. Please credit them!

French version

Improving power tower/poles mapping without tower:type

Posted by InfosReseaux on 26 October 2019 in English. Last updated on 9 January 2020.

Power lines mapping has been a common practice for years and their supports can be used as landmarks in the country. There is undergoing work to improve the way we describe lines supports, including towers, not only for power but for telecom or other utilities as well. This diary will help to understand how is it going.

Currently, power functions find corresponding values in tower:type key. Main tower:type key use case is certainly to define the shape or the purpose of a tall and thin building.

As :type suffix may not be desirable since it doesn’t bring any extra information, I’m currently contributing as to cleanup this key in the power lines context and encourage the use of more meaningful terminology to make the same information more accessible, known as line attachments and management.

These concepts aren’t restricted to power towers and would have been redefined on other kind of power supports if nothing hadn’t been done in past months to cover the need to give more and more consistent information about infrastructure.

Currently, tower:type is used with 1139 different values and 14 out of them get more than 1000 uses and yet 9 of them got properly described on wiki. Here is a summary of usage and encouragement or proposal to clean up tower:type key. Tower:type replacement options

Line attachment

https://wiki.openstreetmap.org/wiki/Proposed_features/Lines_attachments

Values suspension and anchor directly refers to the mean used to bound a power line to its support. Then it’s not really about the shape or purpose of the tower directly, as explained in the proposal reviewed earlier in 2019.

As line attachment starts to be an independent feature to map, a new key was proposed to absorb suspension and anchor plus add pin and pulley values as well. Review of the proposal show that tower:type at least misses pin and pulley values to be complete regarding line attachments. This conclusion is not intended to blame mappers or supporters but to show that the introduction of the new key allows to be more accurate on a precise question.

Adoption started right after the vote and line_attachment now reaches more than 5000 uses. Corresponding tower:type values were replaced accordingly with a downgrade of 2k uses. You may compute such beautiful dashboards on this amazing tool at OHsome.org line_attachment adoption progress as of November 2019

Line management

https://wiki.openstreetmap.org/wiki/Proposed_features/Lines_management

Second main power line concept seen in tower:type is kind of line management, to indicate where lines branches, split, transpose or other possibilities. Initially, using those values prevent to indicate how lines are bound to towers with the same power:type key then, a second key ‘‘line_management’’ is required to reflect some remarkable configurations of lines around towers.

A second proposal is now in RFC to define which are the values to use and how they can be moved from tower:type and be available for other kind of supports. It should be said that more details can be put in OSM regarding each proposed value by defining corresponding keys in the future, not in this proposal, if required.

There are 4 values of tower:type key to replace and branch:type to abandon if this proposal get successfully reviewed. Votes will determine if this is an opportunity for the community.

Head ahead

As stated upside, some values remain to be addressed in a dedicated key to only let in tower:type values that refers to the actual tower shape or purpose. If you want to help, discussion regarding them can be opened at any time.

The current management proposal will certainly be refined prior to get voted, feel free to get involved in the review process to help with the concern you may have.

This is only a step to remove necessary :type suffixes from concepts that don’t require it and bring to OSM a more elaborated set of terms in tagging. Mapping utility supports like power towers or telecom pole is a worldwide challenge. For instance in France, professionals including operators and contractors rolling out overhead telecom cables are currently looking for approx. 16 millions missing shared power poles that weren’t mapped in operational GIS. There’s no doubt updating OSM can help.

François Lacombe / @InfosReseaux

Power substation 
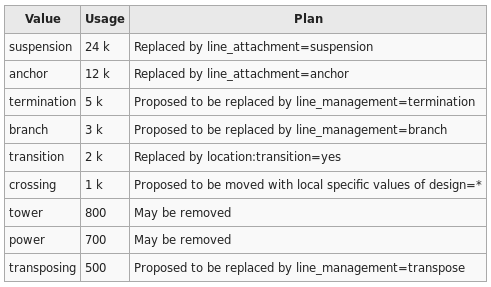
Infrastructure cartography is the main topic I’m involved in in OpenStreetMap and certainly one of many good reasons of why such a free project is valuable nowadays. It’s really useful to get such data as a professional, to work for many network rollout or operation company. It’s also important as a citizen, to get a better understanding of how a city or our own district actually breathe or get fed by its different man made supplies. Everyone is able to more and more use OSM to get many other data than the road network which was the main initial proposal of the whole project.

I’ve been contributing to OSM for seven years now, both on the field to edit the map in the places I went and for the tagging model also. The last is literally the key to empower people to collect relevant information from any sources. I feel the need to sum up here rich discussions, interesting collaborations and the challenge the community achieve right now.

How OSM helps in infrastructure knowledge?

Mankind began really early to roll out primitive infrastructure as to make trading between civilizations or later cities and countries. Roads are the first network which was built. Industrial revolutions and technology allow us to transmit not only goods but power, telecom signals or any utilities on furthest distances than ever. Cartography helps a lot to not only specify how we want to roll out any new network but to make things smarter and take the best advantage of existing infrastructure. Due to economic or competition pressure, specialised and industrial operators didn’t get the habit to share their knowledge or build common inventory of their assets. Public administrations spend high amount of power and money to manage underground and urban spaces documentation as to ensure the reliability and sustainability of our deeply industry dependent societies. Nevertheless, anyone don’t have any guarantee that proprietary data quality is maintained at an appropriate level and collaboration may help anyone to achieve such goals.

OpenStreetMap comes as the first opportunity to document the physical infrastructure at world scale with a unified tagging model. Its role can go far beyond the information of humans only and can be searched by machines too with a sufficiently documented tagging model. This is what I find interesting in OSM approach and the several tagging proposals I get involved in were intended with this idea in mind.

Required consensus may be hard to get on technical topics like power networks mapping. Discussions may be tough but remains a valid way to get things adopted at a large scale.

How infrastructure knowledge can helps OSM to get better?

Getting involved in tagging improvement shows a different face of OSM project. Infrastructure and networks cover several fields of knowledge. Finding a common way to document them all sounds like a very challenging idea. This is an occasion to use existing tags and create new ones to bring that all more consistent and versatile. It won’t be possible (or less possible, with extra effort) to merge official data if we keep our very own way of thinking instead of mapping factual and objective information. Even if today we’re only able to get data from aerial imagery, tomorrow it won’t. Our tagging model shouldn’t be designed of what we can do today but should take care of what will be possible tomorrow. We (including me sometimes) confuse too much the relevancy of tags and the availability of data.

Infrastructure mapping makes us writing proposals and finding solutions to document complex and interconnected systems. They are often based upon worldscale shared norms which ease data exchange between OSM and outside repositories. Official data enable us to get missing or hard to obtain information and may speed up the move to more objective tagging. Currently more than 20 proposals regarding infrastructure has been voted, a few of them rejected and a few more are coming. This is a long journey including the introduction of man_made=street_cabinet, power=plant, waterway=pressurised and several power transformers/switches extra attributes.

Keys like location=, waterway= or building=* were well established and reliable to build on them. Power networks mapping has started merely around 2008. 10 years later, while we are using what looks like a “2nd generation” tagging, some figures can be taken out the history of Martin Raifer tool: Power tagging worldwide adoption

While proposals have progressively introduced the tags we use now, some keys have to be replaced or removed from the database as to ensure some consistency in the records. In 5 years, power=station and power=sub_station (respectively abandoned in favour of power=plant and power=substation in 2013) go from 150 000 items to under 30 000. A bit slow comparing replacement of 300k landuse=farm in 2 months but it’s impossible to automatically retag and each item should be checked carefully.

Documentation and quality tools improvements encourage users to contribute, even on technical topics. Mappers may be interested to describe more precisely their surroundings or get more descriptive data in their professional activity. OSM remains the platform to gather it all.

Only a beginning

There is still a lot of things to do as to get a comprehensive map of infrastructure around the globe, especially in developing countries and strong growth areas. Occidental regions may reach a step shortly thanks to many contributors’ implication and operators’ data opening. Here comes the maintenance challenge and dataset cycle of life management which is a different kind of mapping activity.

Tagging we produce can nevertheless be used in many systems. Even outside of OSM. It can be really useful for further building and rollout planning with adapted software that still need to be developed. Feel free to get involved and propose any missing features :)

François OSM Wiki profile

Location: 57640, Grand Est, Metropolitan France, 57640, France