OpenStreetMap

Richard's Diary

Recent diary entries

I’ve released a new version of tilemaker, the command-line utility that takes OpenStreetMap data in .osm.pbf format and makes vector tiles out of it.

It’s now between 45% and 85% faster - you’ll notice the difference particularly in places with complex multipolygon geometries. Memory usage is reduced, particularly in the polar regions. Plus it’s compatible with Geofabrik’s new CC0 “Shortbread” schema for vector tiles.

https://github.com/systemed/tilemaker

New Potlatch 3 release

Posted by Richard on 24 January 2022 in English. Last updated on 25 January 2022.

A handful of minor changes, mostly around changeset behaviour:

  • You can now choose to automatically close a changeset after saving
  • Trying to save into an already-open changeset will show a warning dialogue if the resulting bounding box would be too big
  • The currently open changeset is automatically closed when you quit P3
  • Unpaved roads (as indicated by their surface or tracktype tag) are now drawn with a brown casing
  • Keyboard issues on the latest Macs are fixed

Plus a couple of other little fixes. You can download P3 at https://www.systemed.net/potlatch/download/ .

P3 continues to be offered with Mac and Windows builds plus an AIR file. I’m hopeful that there’ll be a Linux build in due course but that’s waiting on licensing decisions by Harman, who maintain AIR. The Mac build is fully notarized; the Windows build is self-signed so you need to click through a warning dialogue (I’ve experimented with using signtool to fix this but the whole process is so deeply painful that I gave up after many hours of trying).

Potlatch 3 is here!

Posted by Richard on 31 December 2020 in English.

As many of you will be aware, Flash Player is about to be disabled in web browsers.

I’m pleased to announce that Potlatch continues to be available, now as a desktop application. You can download it for Mac and Windows at

https://www.systemed.net/potlatch/

Potlatch 3 screenshot

Potlatch 3 includes OAuth login, support for Remote Control, and other features to ease desktop editing. Other new features include support for Overpass API queries in the Tasks palette, and there’s some exciting stuff to come soon… but more of that in due course. As yet we haven’t found a way of reliably running it on Linux but investigations continue.

Potlatch is of course open source. You can get the source and report issues at https://github.com/systemed/potlatch3.

Thank you to the OpenStreetMap Foundation for supporting this work and to Potlatch’s many users for their edits.

Location: Potlatch, Mason County, Washington, 98548, United States

Potlatch 3.0 beta

Posted by Richard on 18 November 2020 in English. Last updated on 31 December 2020.

You can now download a development version of Potlatch 3.0 to run on your desktop.

At https://www.systemed.net/potlatch/download/ , you can download a Mac native app, or an AIR file for use on Windows or (possibly) Linux.

Potlatch 3.0 includes desktop-editing features such as Remote Control support, overview zoom levels, and an OAuth login flow for saving. Rendering is faster and there’s now Overpass API support in the tasks palette.

Installation on Linux is likely to be complex and I’d welcome reports from anyone who has successfully achieved it.

There’s much more to come in future weeks so watch this space. You can report issues at http://github.com/systemed/potlatch2/issues pending the creation of a dedicated 3.0 repository.

Location: Potlatch, Latah County, Idaho, United States

Potlatch 2 relation shortcuts

Posted by Richard on 22 June 2019 in English.

Potlatch gets fewer new features in a year than iD does in a day, but occasionally something creeps through.

This week/month/year, that’s the ability to add a function key shortcut (F1-F4) to a relation. Open the relation dropdown menu in the advanced relation panel, choose “Assign to F1” (or whatever), and from then on, you can add the current selection to that relation by pressing the key. It’s particularly useful when building route relations.

Function keys can, of course, also be used for memorising tag combinations and for switching between background layers.

Bringing third-party data into OpenStreetMap has always been a pain point. Simple bulk imports can bulldoze existing community work and cohesion. Editors such as JOSM or even Potlatch 2 have extensive merging functionality but a steeper learning curve and little ability to remap/rewrite data internally. Yet third-party data can often be valuable - especially if it was originally hand-collected to the same standards that OSM volunteers work to.

OSM Live Conflation is a new tool and workflow that builds on the approach taken by OSM Conflator, Cygnus, the JOSM Conflation plugin and the Potlatch 2 merging tool. It remaps data from vector tiles into OSM data, and lets you bring items across one-by-one quickly and efficiently.

A picture is worth a thousand words:

OSM Live Conflation

Or if you want to play with a live instance, here’s a volunteer-collected dataset of cycling infrastructure in West Oxfordshire. (Don’t upload unless you actually want to make an edit to OSM, of course!)

User workflow

On the left is the source data. Clicking a feature shows the tags/attributes associated with it, and identifies a candidate in OSM for that feature: that’s highlighted in the map on the right, and the proposed changes listed.

You can choose to accept the change, or ignore the feature. If the candidate is wrong, then you can choose from several others, or choose to create a new OSM object. When you’re done, click ‘Upload’ to make the edit in OSM.

Project owner

That’s the user workflow. What about the project owner?

First you need to get your data into vector tiles. The easiest way to do this is to put the data in shapefiles (using ogr2ogr) then use tilemaker to create vector tiles. With tilemaker, you write a small Lua script to remap the shapefile attributes into OSM tags: here’s a simple example.

You then deploy an instance of the OSM Live Conflation site including your vector tiles. The site includes a small Ruby server to serve vector tiles, metadata, and static files. The main interface is, of course, Javascript.

iD integration

The vector tiles can be loaded directly into iD using a URL such as https://conflation.cycle.travel/{z}/{x}/{y}.pbf . I hope to be able to increase the integration once iD’s third-party features support lands.

Thanks and further work

Work on this project has been supported by the Open Data Institute via Oxfordshire County Council - thank you!

Development is at an early stage and I’m very happy to offer advice and support to anyone interested in experimenting with this tool. Leave a comment here, email me at richard@systemeD.net or find me on OSM’s IRC channels.

You can see an initial to-do list at https://github.com/systemed/conflation/issues/1 .

(Yes, I did write yet another editor :) )

Two small Potlatch 2 updates

Posted by Richard on 14 November 2018 in English.

Last week there was a small change to the API which means some GPS traces are now returned unordered whereas previously they may have been ordered. This obviously has implications for editors’ GPS display. Potlatch 2 now copes with this by doing some basic proximity testing in an attempt to ‘reorder’ the unordered points, which restores the GPS layer to some degree of sanity.

At the same time, I took the opportunity to fix something that’s been bugging me for months. Historically, Potlatch 2 draws all the features crossing the current viewport, and then removes the sprites when they’re no longer visible. This is fine except when you pan across a 2000km power line, which takes ages to draw as a dotted line at z19, and bogs down Flash’s display performance for evermore. For such large objects, P2 now only draws the on-screen part, which makes it a whole bunch snappier.

Well, you know, it’s been a while since I wrote an OSM editor and I found myself missing the experience.[1]

We’ve pretty much reached the apotheosis of the traditional OSM editor workflow. There isn’t any point building another iD, because iD is terrific and does everything that needs to be done. There might be some merit in building a new native power editor for macOS, say, but even that would be a marginal gain and the sort of project best attempted by a company which employs dozens of mappers.

But we certainly haven’t reached the limit of OSM editing. The traditional workflow was never designed for integrating third-party datasets, for working with street-level imagery, for surveying on a smartphone, for QA. These activities were unheard of in 2006 when JOSM and Potlatch 1 were first conceived, but are big parts of today’s OSM data landscape.

So we should be experimenting with different editor experiences, to see if we can attract wider contributions through presenting an alternative workflow/UI.

Deriviste

Deriviste is a POC for a big-screen street-level editor. POC may equally stand for “proof of concept” or “piece of crap” given that it’s really just 300 lines of Javascript I knocked up over a day.

The idea is that the Mapillary street-view takes centre stage, and you can add POIs by just double-clicking on the imagery. My initial use case was small towns in the rural US that are less likely to get an editing community any time soon, but which might get drive-by street-cammers recording imagery that can be used to map POIs.

It isn’t really an editor, in that you can’t read and modify anything, only write. There’s no dupe detection, the presets are a very simple hack on the iD .json file, and it suffers a little from Mapillary JS’s capriciousness (sometimes it’ll find a lat/lon from clicking on the imagery, sometimes it… won’t). It’s a POC. I don’t have any great ambitions for developing it into something world-beating, but you’re welcome to have a play, and if you like, send patches!

Source code: https://github.com/systemed/deriviste

[1] this may not be true

Debugging Lua scripts/profiles

Posted by Richard on 13 November 2017 in English.

osm2pgsql and OSRM can both make use of Lua scripting for tag processing, which in many cases is the best way to make sense of the often conflicting and confusing tag soup in OSM.

Firing up an osm2pgsql/OSRM run each time is, however, not the fastest way of debugging your Lua. So here’s a little script that reads your Lua osm2pgsql code, passes it the tags from a way, and returns the result:

# Test osm2pgsql Lua scripting with Ruby

require 'rufus-lua'
require 'overpass_api_ruby'
require 'pp'

# Initialise
overpass = OverpassAPI::QL.new
lua = Rufus::Lua::State.new
lua.eval('require "name_of_my_lua_script"')

# Get tags for the way
way_id = ARGV[0]
response = overpass.query("way(#{way_id}); (._; > ;);out;")
tags = response[:elements].find { |h| h[:type]=='way' }[:tags]
pp tags

# Convert keys from symbols to strings
lua['way'] = Hash[tags.map{|(k,v)| [k.to_s,v]}]

# Run Lua code
cmd = "res = {}; filter,tags,poly,roads=filter_tags_way(way,nil); return tags "
pp lua.eval(cmd).to_h

Call it with a way ID like this:

ruby test_lua.rb 35222450

When I do that on my osm2pgsql script, I get:

{:access=>"private", :highway=>"service", :source=>"OS_OpenData_StreetView"}
{"highway"=>"private_road",
 "access"=>"no",
 "z_order"=>0.0}

In other words, the input tags followed by the output tags.

It’s fairly easily adaptable for OSRM profiles, or for other functions in your osm2pgsql Lua script, or whatever.

I chose to write it in Ruby because there’s a ready-made Overpass gem and I’m generally a bit more comfortable in Ruby than Lua, but you could of course do the whole thing in Lua if you were so inclined.

Cycle node networks and mountain passes

Posted by Richard on 4 October 2017 in English.

I’ve just added support for a couple more tags to cycle.travel’s directions and thought it worth mentioning - everyone likes seeing their mapping being used.

First up, cycle.travel now includes ‘knooppunten’ (cycle node networks) in turn-by-turn directions. These are found in the Netherlands, Belgium and parts of Germany, and help you navigate dense cycle route networks. Here’s an example: https://cycle.travel/map/journey/51597

Knooppunten example

This picks up rcn_ref= or lcn_ref= tags on nodes.

cycle.travel also includes mountain passes in the turn-by-turn directions, for people who like riding somewhere hillier: https://cycle.travel/map/journey/51600

Mountain pass example

These are nodes (on highways) tagged natural=saddle or mountain_pass=yes with a name tag. If there’s an ele tag, this will be output too.

Live in Western Europe now; will be in North America in the next update in a week or so’s time. cycle.travel mapping and routing is updated from OSM roughly once a month. And thanks to everyone who has added knooppunten and mountain pass info to OSM!

OpenStreetMap is navigable for bikes, on foot, and increasingly so for cars. But one thing we’re not yet great at is truck routing.

HGVs, lorries, trucks, whatever you call them, need to get from A to B without breaking either the road or themselves. Which means the map needs to know about height and width restrictions. 11foot8.com is a good example of what happens when truck drivers don’t have this information (and also can’t read):

11foot8.com

OSM coverage is good in parts but patchy. Fortunately, the existence of open street-level imagery means it’s really easy to map this sort of thing from the comfort of your own armchair. Here’s a brief how-to.

Step 1: Identify low bridges

The majority of important restrictions are height restrictions, and the great majority of height restrictions are railway bridges. (There are a few canal aqueducts too, though canal-related restrictions are generally weight restrictions on overbridges.)

So one way to find potential low bridges is to follow a railway on the map, looking for instances where the railway crosses the road on a bridge, rather than the other way round (or a level crossing). Doing this systematically is pretty easy.

Or you can automate it with this clever maxheight map, which looks for exactly this scenario, and highlights the map accordingly. (Github code here.)

Step 2: Find height from imagery

You can use Mapillary or OpenStreetCam as open(-ish) equivalents of Google Street View. Here, for example, is a railway bridge captured on OpenStreetCam.

Personally I like to use Geograph, the long-running UK georeferenced photography project. You can go straight to Geograph itself, but I actually use my own bike route-planner, cycle.travel, which has Geograph photos integrated into it. First you plan a route under the bridge:

plan route

then you click the road, and ‘View photos’:

see photos

and hey presto, you can see there’s a pic showing the height limit signage. Click that to see the full-resolution picture on Geograph.

There’s even an (undocumented?) option to show Mapillary views directly in the OSM Maxheight Map: http://maxheight.bplaced.net/overpass/map.html?mapillary=true

Step 3: Map it!

Just split the road to create a short way underneath the bridge, and add a maxheight= tag. You can use imperial units without a space (maxheight=12'9") or metric with a space (maxheight=4.5 m).

The results

It’s a really simple, straightforward process that makes the map instantly usable for truck routing. I fixed the bridges on the Cotswold Line railway (from Oxford to Worcester) in half an hour, from Geograph and personal knowledge. Greatly improving maxheight coverage in the UK should be doable in weeks rather than years. And, of course, it’s a good excuse to get out and survey those places where the height isn’t visible from imagery.

Once you’ve reviewed a whole railway, consider noting your work somewhere so that others can focus on other railways. I’ve started a wiki page for the UK at https://wiki.openstreetmap.org/wiki/United_Kingdom_bridge_heights .

Potlatch 2.5

Posted by Richard on 25 March 2017 in English.

A new version of Potlatch 2 with several improvements and bugfixes:

  • ‘New-style’ multipolygons are supported, where the tags are placed on the relation rather than the outer way. When you edit such a multipolygon, look at the bottom of the tag editor; you’ll see that it’s displaying the relation tags rather than the way. If you do want to change the tags on the way, you can choose that from the little dropdown menu there.
  • Pop-up dialogue boxes are now generally resizable.
  • In the Advanced tag view, long tag values now wrap onto multiple lines.
  • The background menu is now usable on smaller screens.
  • A ‘Clear all’ button on the Bookmarks menu.
  • Shift-drag to zoom into a particular area; shift-click + or - to zoom three levels at a time; and you can now zoom out beyond zoom level 14, in which case no data will be displayed or loaded.
  • Shift-< and > jump 10 nodes at a time along a way.
  • Code now compiles with Apache Flex as well as with (older) Adobe Flex.
  • Plus a bunch of other small fixes.

Potlatch 2 is somewhere between ‘active development’ and ‘maintenance mode’: there’s no massive new features that I’m planning, but I intend to keep making small improvements to it along these lines, plus extra features as and when I’m doing some mapping and figure out a way to make it easier or quicker to use. OSM is lucky to have such an excellent default editor in iD, which gives P2 the freedom to develop as an efficient and comfortable editor for those who like its way of doing things.

Potlatch 2: bookmarks

Posted by Richard on 5 July 2015 in English.

A new little feature for Potlatch 2: you can add a bookmark for your current location, accessible via a new ‘Bookmarks’ dropdown menu. Use the ‘Add’ button at the bottom of the menu to add a new one. It works pretty much like every bookmarks menu you’ve ever used, to be honest.

There’s also a new trademark obscure keypress, ‘N’, which moves to the other end of the currently selected way.

What's your OpenStreetMap story?

Posted by Richard on 28 May 2015 in English.

Everyone has their own reason for contributing to OpenStreetMap. Maybe you wanted a better map for your favourite activity - hiking, cycling, skiing. Maybe you were using a site or device with OSM data, and found it lacking. Maybe a friend got you involved. Maybe you believe in our aims as an open project. Or maybe you just thought it was cool.

What was your reason?

I’m giving a talk at State of the Map US in just over a week, in which I’d like to share people’s stories as to why they contribute. I’d love to hear yours.

You can post in the comments here, drop me a line at richard@systemeD.net, send me an OSM message, or reply on Twitter. (Anonymity offered if you want!)

Fixing the rural US

Posted by Richard on 28 January 2015 in English.

Folks, I’ve made an exciting discovery. I’ve stumbled across a country on the map which has 46 million inhabitants but is barely mapped. There appears to have been an import several years ago of a poor-quality dataset, and since then it’s languished untouched. There’s no indigenous mapping community. Can we help this poor beleaguered country to get a decent map?

Ok, you may have figured where I’m talking about. It’s the rural US: 72% of the landmass, 15% of the population. And it needs your help.

The problem

For the past couple of months I’ve been using idle moments to address a particular, and very widespread issue in OSM’s coverage of the rural US - the highway=residential problem.

TIGER data, which forms the bedrock of OSM data in the US, classes roads by CFCC - ‘Census Feature Class Code’. By far the most prevalent is A41 - “Local, neighborhood, and rural road, city street, unseparated” - and the TIGER import translated this to highway=residential. This was a good fit in urban areas but covers a multitude of sins in rural areas - everything from good, fast state highways to rutted forest tracks or worse.

The effect is that our map of the rural US shows pretty much everything, save the biggest roads, as a residential road. Tarmac road with sweeping curves and a painted centreline? highway=residential. Gravel road? highway=residential. Forest track? highway=residential. Vague two-foot clearing through the woods where someone perhaps rode 50 years ago? highway=residential. Ploughed field? Etc, etc.

Rural crossroads

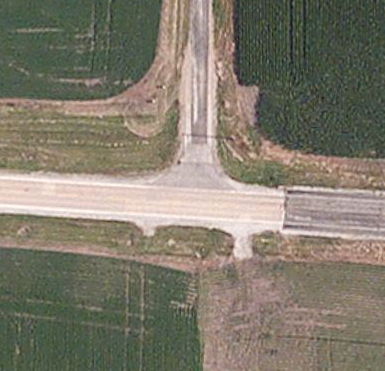
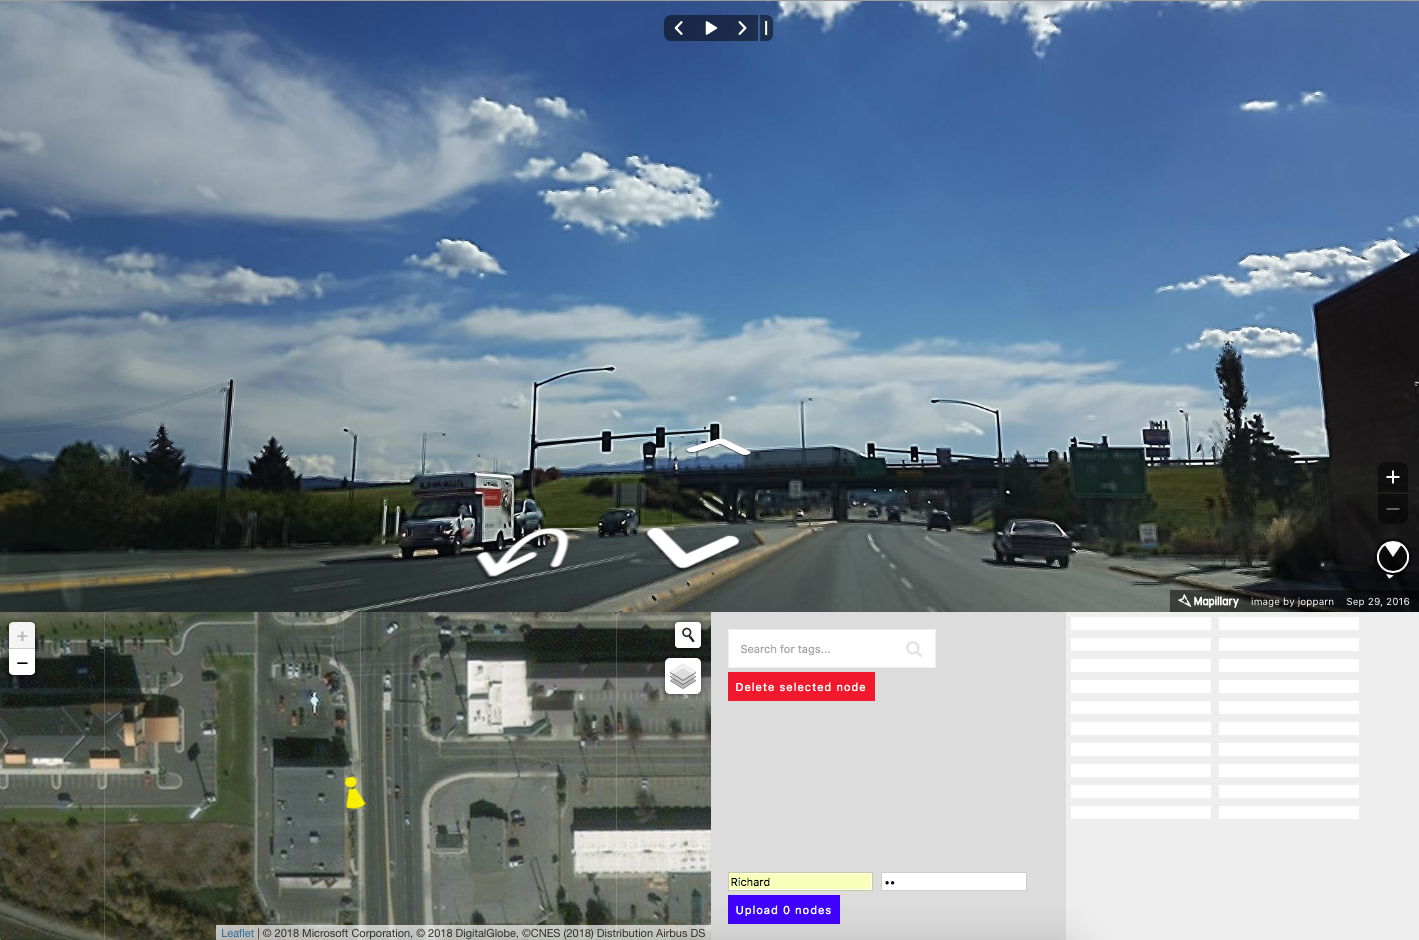
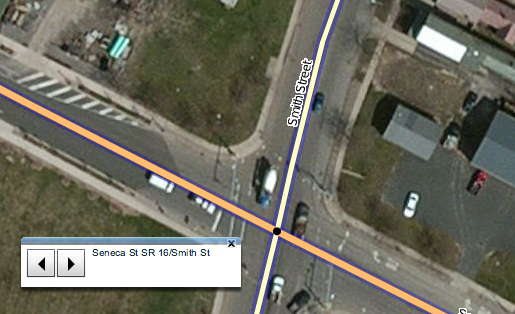
This is a typical example from an agricultural area. A good-quality road with centreline, running east-west: a smaller access road, running north: and nothing at all running south. In OSM, this is mapped as a crossroads with highway=residential roads in all four directions. Having the edge of a ploughed field marked as highway=residential doesn’t make for a great map, nor does it make for good routing results. “In 100m, turn left.” “BUT THAT’S A FRICKING FIELD YOU ACCURSED MACHINE.” Sigh.

Rural crossroads

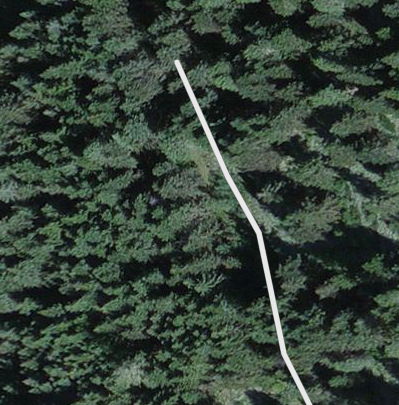
But if you really want some fun, find a less cultivated area - this forest, for example. Look at all those lovely residential roads, tagged exactly the same as a paved city street. Except none of these are paved. A few might be gravel. Many don’t really appear to exist at all.

Most of this remains unchanged. In some areas a dedicated user has cleared it up and there’ve been a few energetic nationwide editors, but it’s a massive job. It’s pretty much endemic - even just a few miles from San Francisco, a hotbed of OSM activity, you’ll find examples.

Perhaps we shouldn’t have imported TIGER in these rural areas, but just let the map grow at its own pace. That way, the important roads would have been surveyed, traced, or imported one-by-one, and the thickets of near-impenetrable tracks would probably have never made it in. But we are where we are, and though I’m generally sceptical of “armchairing” far-flung data, we have a big heap of flat-out wrong data and no other strategy to deal with it.

A framework for fixup

So I’ve been fixing up roughly along these lines, though obviously adjusting for local sensitivities and network considerations:

  • highway=tertiary - paved 2-lane road with painted centreline
  • highway=unclassified - other paved road
  • highway=unclassified, surface=unpaved - unpaved road (at least a car’s width, consistent surface)
  • highway=track - unpaved, often doubletrack/singletrack
  • highway=service - access to private house or farm
  • (delete entirely - no trace of trail/road)

Most of this is fixable from imagery. There are also some good datasets: Arnold, Forest Service data, various state data, etc.

In forests 90% of highway=residential should really be tracks. In the plains, the majority is either track or unpaved road, often in grids, but with the occasional paved through route. In Missouri, Tennessee, Kentucky and eastwards you start to see more paved roads.

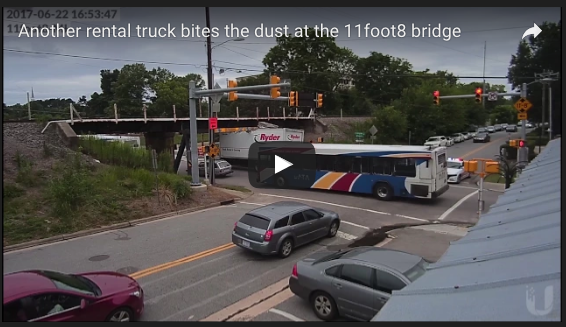
Personally, my main priority has been to identify and retag paved through routes. Often these can be identified by squinting at the map: a river bridge is a tell-tale indicator, or a road with wide curves, or one linking settlements. Sometimes you just need to look at the aerial imagery and pan around. Of course, it’s not just the highway tagging that needs fixing - ref tags and geometries would benefit from attention, too - but you can’t do everything, so my chosen challenge has been to get the tagging sane.

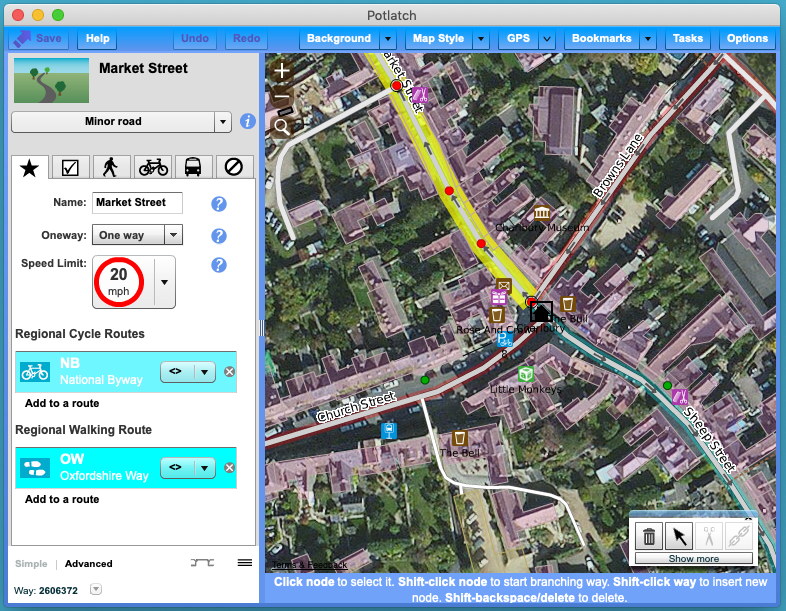
I just use plain vanilla Potlatch 2 for fixup, accelerated by assigning common tags to function keys. One day it’d be nice to build something MapRoulette-like to tackle the issue, a bit like HotOrNot (TrackOrCack? HighwayOrLieway? RoadOrFOAD?). But for now a normal editor does fine.

So if you’re sitting in your armchair with an itchy OSM finger, resist the temptation to normalise some tags or trace some buildings or whatever else you might usually do. Come and fix up the rural US.

Potlatch 2: quickly move from task to task

Posted by Richard on 20 December 2014 in English.

Task-based fixup workflows, such as MapRoulette, To Fix, and the HOT Tasking Manager, have become popular in OSM in recent years, presenting a series of map-improvement tasks for a user to complete.

MapRoulette is wondrous in many ways but has three issues. First, if you’re using an online editor, the time taken to open each task is significant - around 3-5s to open a new instance of iD for each task. Second, that online editor has to be iD, so it’s not suited for those of us who use P2. Third, the process for creating your own tasks is fairly cumbersome, especially if you’re working on a small series of tasks to be completed by one or a few people.

Potlatch 2 now implements a fast, light way of moving through a series of tasks. It’s intended for small-scale personal work rather than planet-sized challenges. There’s no ‘resolve’ button - it’s just a way of moving between locations efficiently.

It works like this:

Create (or find) a GPX or GeoJSON file containing the locations.

If it’s a GPX file, it should contain waypoints. Each one can have a description in a <desc>, <cmt>, or <sym> element.

If it’s a GeoJSON file, it should contain Point features. Each one can have a description in the ‘name’ property (or, failing that, the first property).

Open it in Potlatch 2 with the Tasks button.

Potlatch 2 Tasks button

You can either load a file from disk, or type a URL and click ‘Fetch URL’. (For the latter, note that the usual nonsense about needing a crossdomain.xml file at the root of the server applies, sadly.)

Move from task to task with the palette.

Potlatch 2 Tasks palette

The map will centre on the first location. When you want to go onto the next one, click the forward arrow. To go to the previous one, click the back arrow. And that’s it.

Try it for yourself using a GPX file of waypoints. If you don’t have one to hand, these files from the Adventure Cycling Association of long-distance cycle routes across the US are fun.

I’d be interested to hear of other formats this could support, and further suggestions for improvement; and it would be lovely if authors of other editors were also interested in exploring the idea.

Klamath Forest

I’ve created a set of tiles from US Forest Service road data for the 155 US National Forests.

This is to help with TIGER fixup in these rural areas, where tracks, trails and entirely non-existent paths are often tagged with a bare “highway=residential”. The US Forest Service data is greatly superior to the original TIGER data and has metadata on surface type/quality, but is unsuitable for automatic import into OSM because it would overwrite mappers’ existing work in these areas.

You can access the tiles at:

and they’re included in the editor-imagery-index list used by P2, iD and Vespucci. The tiles are available up to z19. Use of Potlatch 2’s new floating imagery window mode is recommended, so that you can work from both Bing imagery and these tiles at the same time.

You can also explore from the comfort of your browser at http://osm.cycle.travel/index.html, where there’s an “Edit this area in OpenStreetMap” link at the bottom right.

Key

  • Surface:
    • yellow outline = paved
    • grey outline = gravel
  • Road type:
    • white with black casing = paved road
    • dashed grey = gravel road suitable for cars
    • dashed brown = dirt road
    • dotted grey = not maintained for cars
  • Maintenance level:
    • grey dots = 4x4 only
    • green dots = usable by cars
    • black dots = moderately comfortable for cars
    • black frequent dots = very comfortable for cars
  • Points of interest:
    • car = roadside park
    • flag = Forest Service station
    • ski = winter recreation area
    • hiker = trailhead
    • campsite = campsite
    • picnic site = picnic site

(There’s some degree of overlap, but this is present in the original USFS data.)

When fixing up data, I would suggest the following tags as a minimum:

  • highway=unclassified - paved road
  • highway=unclassified, surface=unpaved/gravel/dirt - unpaved road suitable for cars
  • highway=service - road to isolated dwelling or other building
  • highway=track - unpaved track or road suitable for 4x4s
  • highway=path - narrow linear clearing, too narrow for motor vehicles
  • [delete entirely] - raw TIGER data with no signs of track or path in either imagery or Forest Service tiles

US Forest Service data is public domain so there’s no need for further attribution when using this data, though a source= tag is always good practice.

Hope these are helpful, and let me know of any further suggestions.

I know. Two new features in the space of a week. Don’t get too used to it.

P2 now has a ‘Show floating window’ checkbox in the Background menu. Select this, and you’ll get a second set of imagery in a floating window:

dual imagery

The window follows your main cursor location. So you can have Bing in the main window and Ordnance Survey StreetView in the floating window, or a blank background in the main window and Bing in the floating window, or whatever you like.

There’s a “lock zoom” checkbox to stop the floating window zooming in or out - for example, edit at z18 with Bing but see OSSV at z16; or edit at z14 with Bing but have the floating window at z19 for a close-up view. It also respects the “max_zoom” parameter of the editor imagery index.

I coded most of this at a hack weekend a year ago but had never got round to finishing it off. Hope it’s useful.

At the same time, P2 now makes a passable fist of rendering multipolygons where the tags are on the relation rather than the outer way (yeuch). It’s not perfect and it won’t do any of that crazy “advanced multipolygon” stuff. But it’ll do until we finally get an area datatype.

GORDON'S ALIVE

Posted by Richard on 14 October 2014 in English.

Flash?

And so is Potlatch… just about. (Insert obvious Flash reference here.)

Potlatch 2’s core purposes are (a) being an intermediate-level editor and (b) annoying Germans. It’s never going to get major new functionality or important rewrites, but for those of us happily using it, I’ve always intended to add and fix little things over time.

In the summer it gained support for the editor-imagery-index project, which provides a central list of background imagery suitable for tracing. Today it has a couple of improvements to the long-standing feature where you shift-click away from a way to add a new point (roughly comparable to JOSM’s “Improve Way Accuracy” mode, but we don’t do modes round here) - which is a really useful technique for TIGER fixup.

I’ve also added the ability to memorise tag combinations and recall them by a single keypress. Very simple: press shift and a function key to memorise the tags from the current selection. From then on, pressing that function key will add the tags to the selected items. (Those with long memories may remember this is a Potlatch 1 feature, and one I’ve always meant to add to P2!)

I have a couple of larger features which are 90% coded but were never quite finished, both firmly “intermediate-level” tools. As and when I get the time, I’m hoping to finally finish them off and get them out there.