
How large are our national contributor communities and how are they developing?
Posted by SimonPoole on 22 November 2015 in English. Last updated on 14 February 2016.For a long time I’ve been wanting to produce some numbers detailing the size and growth of our national contributor communities. While a lot of things are sort of assumed to be true for example that the D-A-CH region is by far the largest community we’ve been missing some hard numbers.
Given the awful weather this weekend I at last had some time to finish off what I had started on a couple of weeks back.
So that you can play around with the numbers yourself and have a look at what interests you I’ve dumped the output in to a LibreOffice spreadsheet.
Some interesting things that I produced for myself:
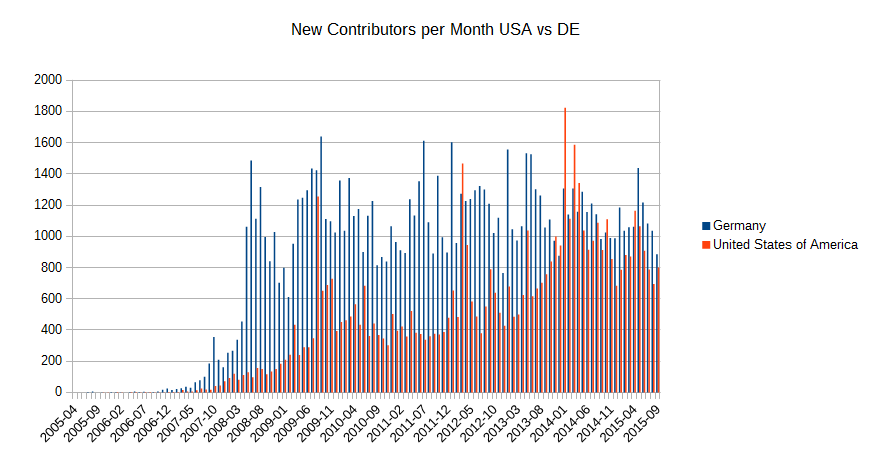
The above graph shows new contributors per month for the US and Germany, it clearly shows that the adoption of OpenStreetMap in Germany was very strong early on in the projects life and has essentially continued at that level since 2008. The US on the other hand has a completely different history with the growth rates picking up substantially in 2014. It should be noted that the US is nearly three times more populous than Germany so the US is still adopting substantially slower than Germany at this point in time.
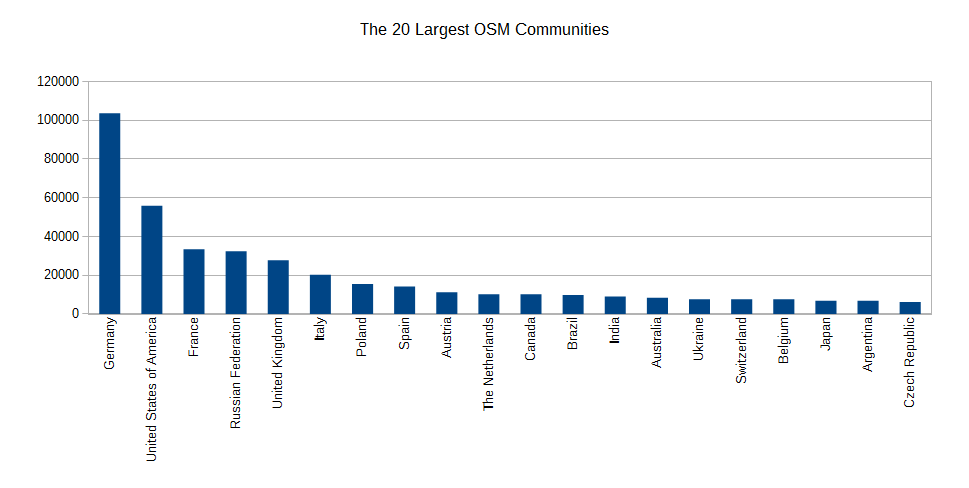
Naturally inquiring minds want to know which community is the largest, no surprise there, it is Germany at nearly double the size of the runner up. But a large population, which is one of the major drivers for the absolute size, is naturally not an achievement. So lets have a look at the contributor number per head:

Again no surprise Austria leads the pack. Note this is a bit unfair in that Vatican City actually has 4 contributors per 1000 population and a couple of the other very small states have higher numbers too, but cutting off at half a million population seems to be reasonably sensible.
Finally how are our contributors distributed over the world:
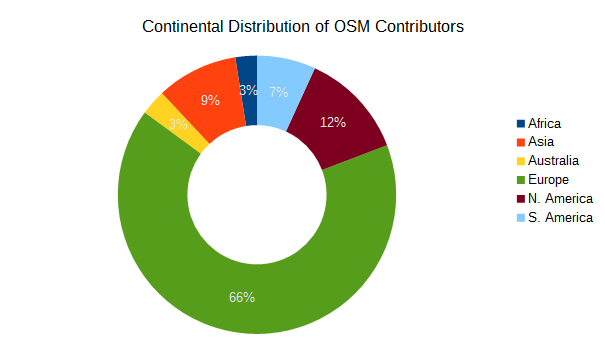
Two thirds of all contributors are in Europe, again no surprise.
Methodology and Caveats (lots of them)
The numbers are generated from geo-coded (country level) changesets and are current as of September 2015. For each changeset the centroid was determined and that compared to a set of OSM derived country boundaries. Of the roughly 35 million changesets 2 million didn’t return a result, aka the centroid was not located in a country (likely over water). The first non-HOT or Missing Maps changeset was used to determine which country a mapper belongs to. Filtering out the identifiable HOT and Missing Maps changesets reduced the overall count of contributors by 8000.
- using the location of the first changeset is naturally a very rough indicator of where a mapper is located and further it naturally doesn’t take migration in any form in to account.
- along borders using the bounding box centroid will potentially lead to miscounts
- very large bounding boxes will cause miscounts
- 6000 accounts couldn’t be associated with a country at all (aka the initial changeset was in the 2 million that couldn’t be geo-referenced)
- prior to the use of hashtags by the HOT community it wasn’t possible to filter out such changesets, as a result the contributor number in targets of HOT activations prior to 2013 should be taken with large grains of salt
- country borders tend to be a bit volatile and you can argue a lot about which continent certain countries belong to.
Discussion
Comment from imagico on 22 November 2015 at 22:46
I suspect one major problem of your methodology is that quite a few mappers start off with either a remote mapping changeset (which does not necessarily have to be part of a HOT project etc.) or mapping in a location away from home (during vacation for example). This will probably not significantly affect numbers for countries like Germany or the USA but it will likely overestimate the number of mappers in countries with a low number of mappers.
Comment from SimonPoole on 22 November 2015 at 23:11
@imagico theoretically yes, however living as I do in a country that is a reasonably popular tourist destination there has been no indication that this is a significant effect over the last two years (where we have looked at every single new mapper).
The other problem is that this effect would only be detectable at all if the mapper in question actually continued to map at home over a significant period of time, which as we know most don’t. (there were only 33’197 contributors with more than 100 changesets as of this September).
Comment from RobJN on 22 November 2015 at 23:43
What lessons can you share for promoting growth (what’s worked for you)? And, what ideas do you have but so far have not tested/implemented?
Comment from pnorman on 23 November 2015 at 03:11
I’d be interested in how the growth of active contributors is per country. This is influenced by both the rate that people join, and the rate they leave. There’s a few ways to define an active contributor, but the contributor terms includes a reasonable one
We can’t easily look at a natural person, but having changesets in at least three months over the last 12 months is the type of criteria that’s easily evaluated.
Overall, the growth is linear in the last few years
More specifically, it’s 232 additional active contributors per month, R^2=0.996.
The problem I had when I tried to break it down was
Maybe these don’t matter and you could just use current location estimates for each active mapper, and then break down the list each month.
Comment from SimonPoole on 23 November 2015 at 09:46
@RobJN I’m on the record as saying this before: it is reasonably easy to cause spikes in our growth by media coverage (we know that because it is easy to track cause and effect in such cases), changing the long term trends seems to be very difficult. There are just are handful, or even less, events that have affected that, the introduction of Potlatch, the licence change, iD. I could speculate on why that is, but the truth is that we don’t actually know what keeps our growth going (my take on it is that it is actually word of mouth but thats unproven).
The good thing to take away from the country numbers is that they show that even in the countries we consider developed in an OSM sense growth rates have flaten out but growth is continuing, in other words there is no reason to believe that you can’t reach > 1 mapper per 1000 in the UK too.
Comment from 5m4u9 on 23 November 2015 at 11:07
One question… on “contributors distributed over the world”, Central America is included in North or South America?
Comment from SimonPoole on 23 November 2015 at 11:24
@51114u9 South, I’m aware that this is controversial, but probably less than including it in NA. See the caveats.
Comment from DaCor on 23 November 2015 at 19:13
Personally, I would be a lot less focused on where there are active communities and more concerned with where there is little to no mapping going on, notwithstanding access to the internet or population
OSM, as a whole does a pretty poor job of helping to develop local communities.
Comment from woodpeck on 23 November 2015 at 19:55
@DaCor my take on this is that local communities will form when the time is right for them, and that no amount of external meddling will have a healthy effect on that timing. The best thing you can do to help a vibrant community spring up in the city down the road is to map and participate in your local community and make that a shining example for the city down the road to follow. Among the less useful or even detrimental things you can do are: Trying to kickstart a community in the city down the road as an outsider; trying to pay people in the city down the road to map or start a community; importing or armchair-mapping data in the city down the road hoping that they’ll thank you for doing their job for them. And of course this is just as true for the country on the other side of the planet as it is for the city down the road.
Comment from DaCor on 24 November 2015 at 18:37
@woodpeck I understand that view however i disagree with it. I think time has proven that sitting back and waiting for things to happen is the worst possible way to growth.
OSM is what, 11 years old now, and has 2-4 registered local chapters, maybe 2-3 dozen other active “communities” and the rest are loners who happen to live within the same boundaries.
Don’t misunderstand me, I’m not talking about kickstarting in the fashion you suggest however without providing some means of enabling local communities to connect inside OSM at a regional or national level, you are losing out on those folks who want to get together and connect simply because they don’t have the means to find others.
In all seriousness, get someone who has never edited OSM before to sit down and create an account on the site and ask them to try connect with the local community. Its not possible. You have to leave the site, go to Google, end up in the wiki and go to an external site, find another means to connect e.g. facebook or other and possibly install software (IRC).
As I said, I am not talking about kick starting in the manner you suggest, I am talking about making it easier for people who want to connect, to actually connect. The rest, as you say will happen naturally, but there are smart “hands-off” things that can be done to facilitate that development.
Comment from SimonPoole on 25 November 2015 at 23:47
@Dacor I’m not quite sure where google is supposed to enter the picture. Even if the newbie in question doesn’t get a welcome mail from the community (which a lot do), it is just a question of clicking on the help tab above to get links to everything relevant.. And further the welcome page every mapper sees contains a link to the same place https://www.openstreetmap.org/welcome
Using IRC (the web interface does not require any software to be installed), the mailing list and the forums does not entail creating a further account and while not super user friendly isn’t quite as unfriendly as you imply.
Naturally more things could be done, and I think we are all waiting with baited breath for somebody to finish off the groups functionality for the website which would make some community things substantially easier.
Comment from joost schouppe on 5 December 2015 at 14:53
I just did some calculations for Belgium based on the history files. I have 8900 contributors by january 2015 (I know, I should get some fresh data). You got to 7622 on more recent data. I think that’s pretty decent, a similar order of difference you get in these comparisons, like I checked here for Brasilia.
Comment from SOSM on 5 December 2015 at 14:58
@joost I have some older numbers based on history files for Switzerland which would inidcate 10-20% higher values if we are looking at in-country edits. So your numbers are likely very compatible with the “first edit” stats.
Comment from pitscheplatsch on 15 January 2017 at 16:11
For the sake of completeness, open access publication: “Analyzing the Contributor Activity of a Volunteered Geographic Information Project - The Case of OpenStreetMap” http://www.mdpi.com/2220-9964/1/2/146/htm