OpenStreetMap

Zartbitter's Diary

Recent diary entries

Stormy Monday

Posted by Zartbitter on 28 October 2013 in English.

stormy monday

Had blackout for some time, streets and motorways are blocked everywhere around by trees or HGV turned over by gusts of wind, all trains and all ferries are stopped, a few people where injured, fortunately none died in our area (Edit: Sadly one man died in a town nearby - he was struck by a tree). Three trees in our backyard are overturned, the roof of our house and the rain pipes are damaged by flying parts but I saved the beehives just in time. The next days I’ll be busy with chain saw, axe and other tools.

That’s what I call a stormy monday!

OpenWheatherMap-Library for your Leaflet map: leaflet-openweathermap, (example map using this library

As you already know, I wrote a JavaScript library (leaflet-openweathermap) to use OpenWeatherMap’s data in your own Leaflet based maps. And I already made an example map using this library (see here). But what else beside the default behaviour can one achieve for a selfmade map using this library? Let’s see …

I’d like to have a look at the wind direction and wind speed. Switching on the “city” layer and clicking on every city marker to see the direction and speed in the popup isn’t satisfying. Yes, I can see all the the numbers but I get no overview of a bigger area.

Fortunately leaflet-openweathermap offers the feature to use your own code to create markers for current weather items.

First I made a dummy method providing a simple marker and added it to the layer as an option. That’s just to be sure that setting my own marker method works:

function myMarker(data) {
    return L.marker([data.coord.lat, data.coord.lon]);
}
var weather = L.OWM.current({markerFunction: myMarker});
// don't forget to add this weather layer to your map 

Instead of the default cities marker I get standard markers. Everything works as desired.

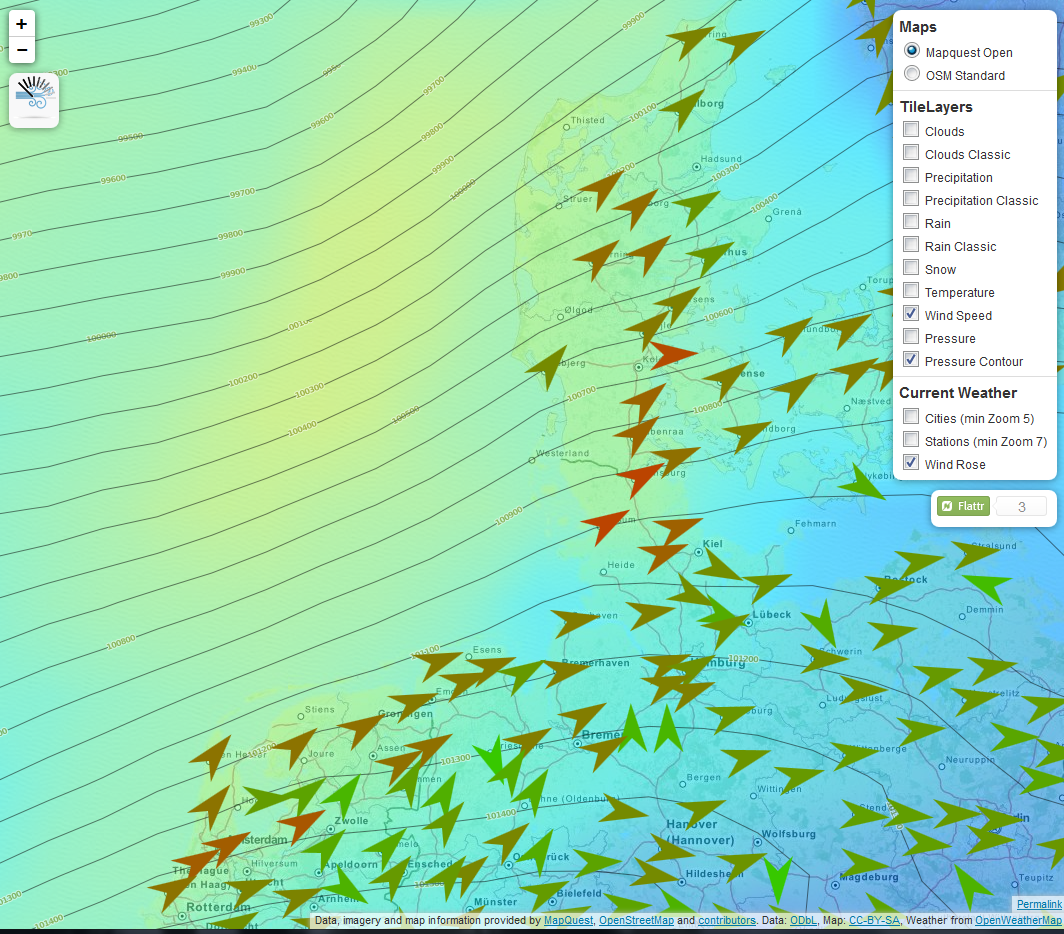
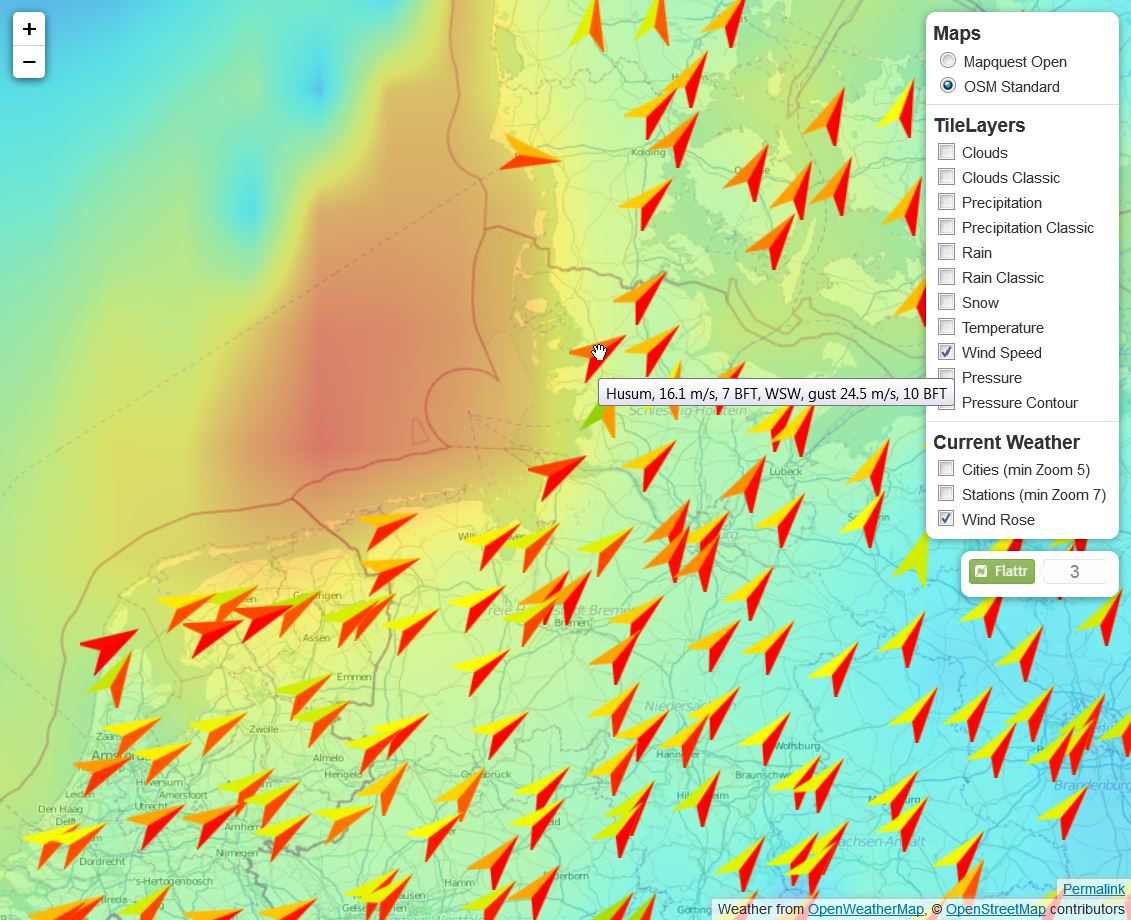
Now I changed my marker method to read wind speed and wind direction from the given data object. Drawing an arrow, rotating it according to wind direction and changing color depending on wind speed was just a matter of programming experience.

And here is the result: open the map or have a look at the screenshot of a stormy day at the German and Danish coastline. stormy day

leaflet-openweathermap - the new javascript library for using OpenWeatherMap’s data in Leaflet based maps has got some updates.

Features

It now supports:

  • Simple access to all tile layers
  • Add your own legend for each tile layer (a few are available out of the box)
  • Simple access to current weather data (cities/stations)
  • Support for OWM’s free API key
  • Caching of current weather items
  • Automated refresh of current weather data every n minutes
  • Loading indicator (which can be customized or switched off)
  • Simple client side clustering of current weather items
  • A lot of configuration options to customize what data to display when using the builtin popup
  • Provide your own function for generating markers or popups
  • Prepared for other languages (en is default, de, ru and fr are available but incomplete yet)

Documentation

All configuration options and some example code how to use this library are documented on Github - have a look at README.md. A wiki page with a short overview is available, too: User:Zartbitter/OpenWeatherMap

Example map using this library: http://map.comlu.com/openweathermap/

Help needed

Are you an expert in meteorologic terms? Are you speaking German, French or Russian? Or do you want to translate everything to an additional language?

OWM sends weather conditions in English and I need translations to de, ru and fr. Some weather conditions are translated, but some are left to you. The translations are in leaflet-openweathermap.js, L.OWM.Utils.i18n starting at line 812 (at the moment). Please try to use the meteorologic terms used by native weather services.

Feel free to contact me if you want to provide some missing translations (or even a yet unused language).

Source

Get it from Github, it is licensed under CC0

Screenshot

OpenWeatherMap for Leaflet

OpenWeatherMap for Leaflet

Posted by Zartbitter on 21 March 2013 in English. Last updated on 8 April 2013.

Do you know about OpenWeatherMap? It offers some TileLayers and current city/station data for weather related data. A basic library is available for Leaflet integration.

To get most out of OWM’s possibilities I wrote another javascript library for Leaflet based maps.The library supports OWM’s TileLayers and current city/station data. It is configurable with many options. For current city/station data the library supports refreshing the data in intervalls, some kind of client-side clustering (show only the station/city with the highest rank for a defined pixel square), custom image set (if you provide one), different languages (“en”, “de”, “ru”, “fr”, but translation is incomplete yet), minZoom and others.

Here you go: leaflet-openweathermap on GitHub

Example map using this library: OpenWeatherMap for Leaflet

Screenshot

Map of turn restrictions

Posted by Zartbitter on 29 January 2013 in English. Last updated on 20 June 2017.

Attention, new Link: https://ahorn.lima-city.de/tr/ (map.comlu.com is down)

This map visualizes turn restrictions and indicates errors and warnings. It is intended to guide you in increasing OpenStreetMap’s routing quality. The map isn’t perfect but it is stable enough for the most of us ;)

There are problems in Internet Explorer prohibiting the loading of restriction data for some browser versions. I checked IE 9 and IE 10, they work for me. Firefox, Chrome, Safari work fine.

Turn restrictions are fetched from Overpass-API, which is updated every few minutes.

Have fun!

Some links:

Wiki, turn restrictions: http://wiki.openstreetmap.org/wiki/Relation:restriction

Wiki, Overpass-API: http://wiki.openstreetmap.org/wiki/Overpass_API

Overpass-API: http://overpass-api.de/