
Some StreetComplete-Statistics
Posted by wielandb on 12 May 2022 in English. Last updated on 16 May 2022.I did some statistical evaluation around StreetComplete, and in this post I describe what I evaluated and what the results are.
(This post is more or less the english text version of this YouTube video, which is in german. There is also a german version of this post here.)
First of all, how did I evaluate this data, or rather, where did I get all the info I’m talking about here? The basis was the StreetCompleteNumbers script that I wrote some time ago. It’s a Python script that can be used to find out the number of solved quests for a user. The script is also available on GitHub. One can use this script very easily:
from StreetCompleteNumbers import StreetCompleteNumbers
StreetCompleteNumbers("wielandb")
Then we just had to find out who are the users whose StreetComplete numbers we want to download. I tried to develop a method that makes as small a number of requests to the OpenStreetMap servers as possible. So simply downloading the entire changeset history for every user I come across should be avoided.
I was using the daily replication diffs since October 2021 (so since half a year ago). I downloaded every diff file, and looked at every changeset that occurred in it. If a changeset contains the changeset tag StreetComplete:QuestType, I trigger a download and save of its numbers for that user. Also, the program remembers for which users it has already saved StreetComplete numbers, so that they are not downloaded twice for the same user.
So I ended up with StreetComplete numbers for 5284 users, which was my database. And so we came directly to the first limitation of this evaluation. Only users who solved at least one StreetComplete quest between October 2021 and March 2022 appear in this statistic.
Before we get to the statistics, it should be said that I do not want to name any users in this evaluation, so we will only see the countries of the top users. So, let’s get to the statistics now:
How many ★ do the top users have?

How many users have disabled quests enabled?
To do this, I created a list myself of quests that were disabled by default and checked for each user in my database to see if they had at least one solution for at least one of those quests. The evaluation showed, one third of the users did not solve a single quest that was disabled by default. In theory, this doesn’t have to mean that these users haven’t activated any of these quests, but since many quests are deactivated because they are so spammy, I think we have a good estimate here.
How many quests were solved in total?
The data I have indicates that over 14 million quests have been solved using StreetComplete. (To be precise, there were 13,975,938 quests at the time of the survey, which is why the percentages in the table below are based on this figure).
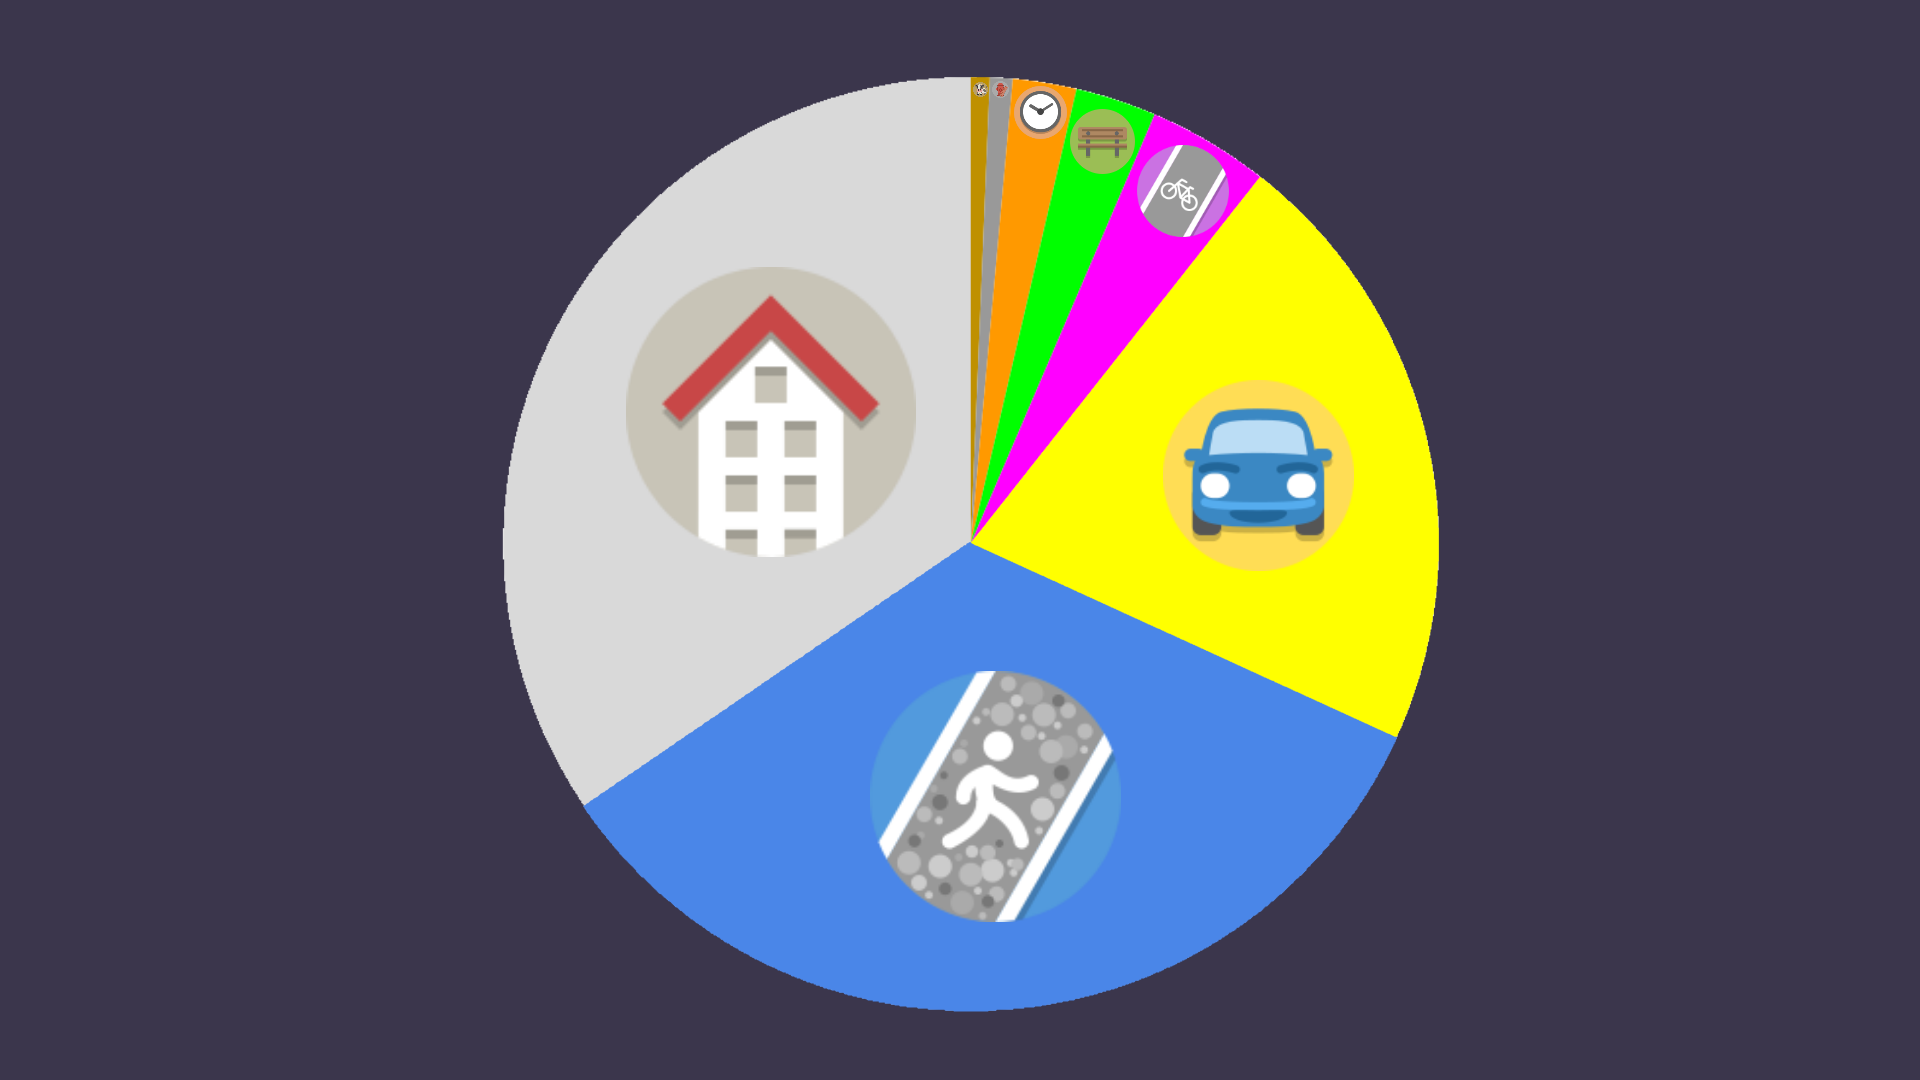
How are the solved quests distributed among the colors?
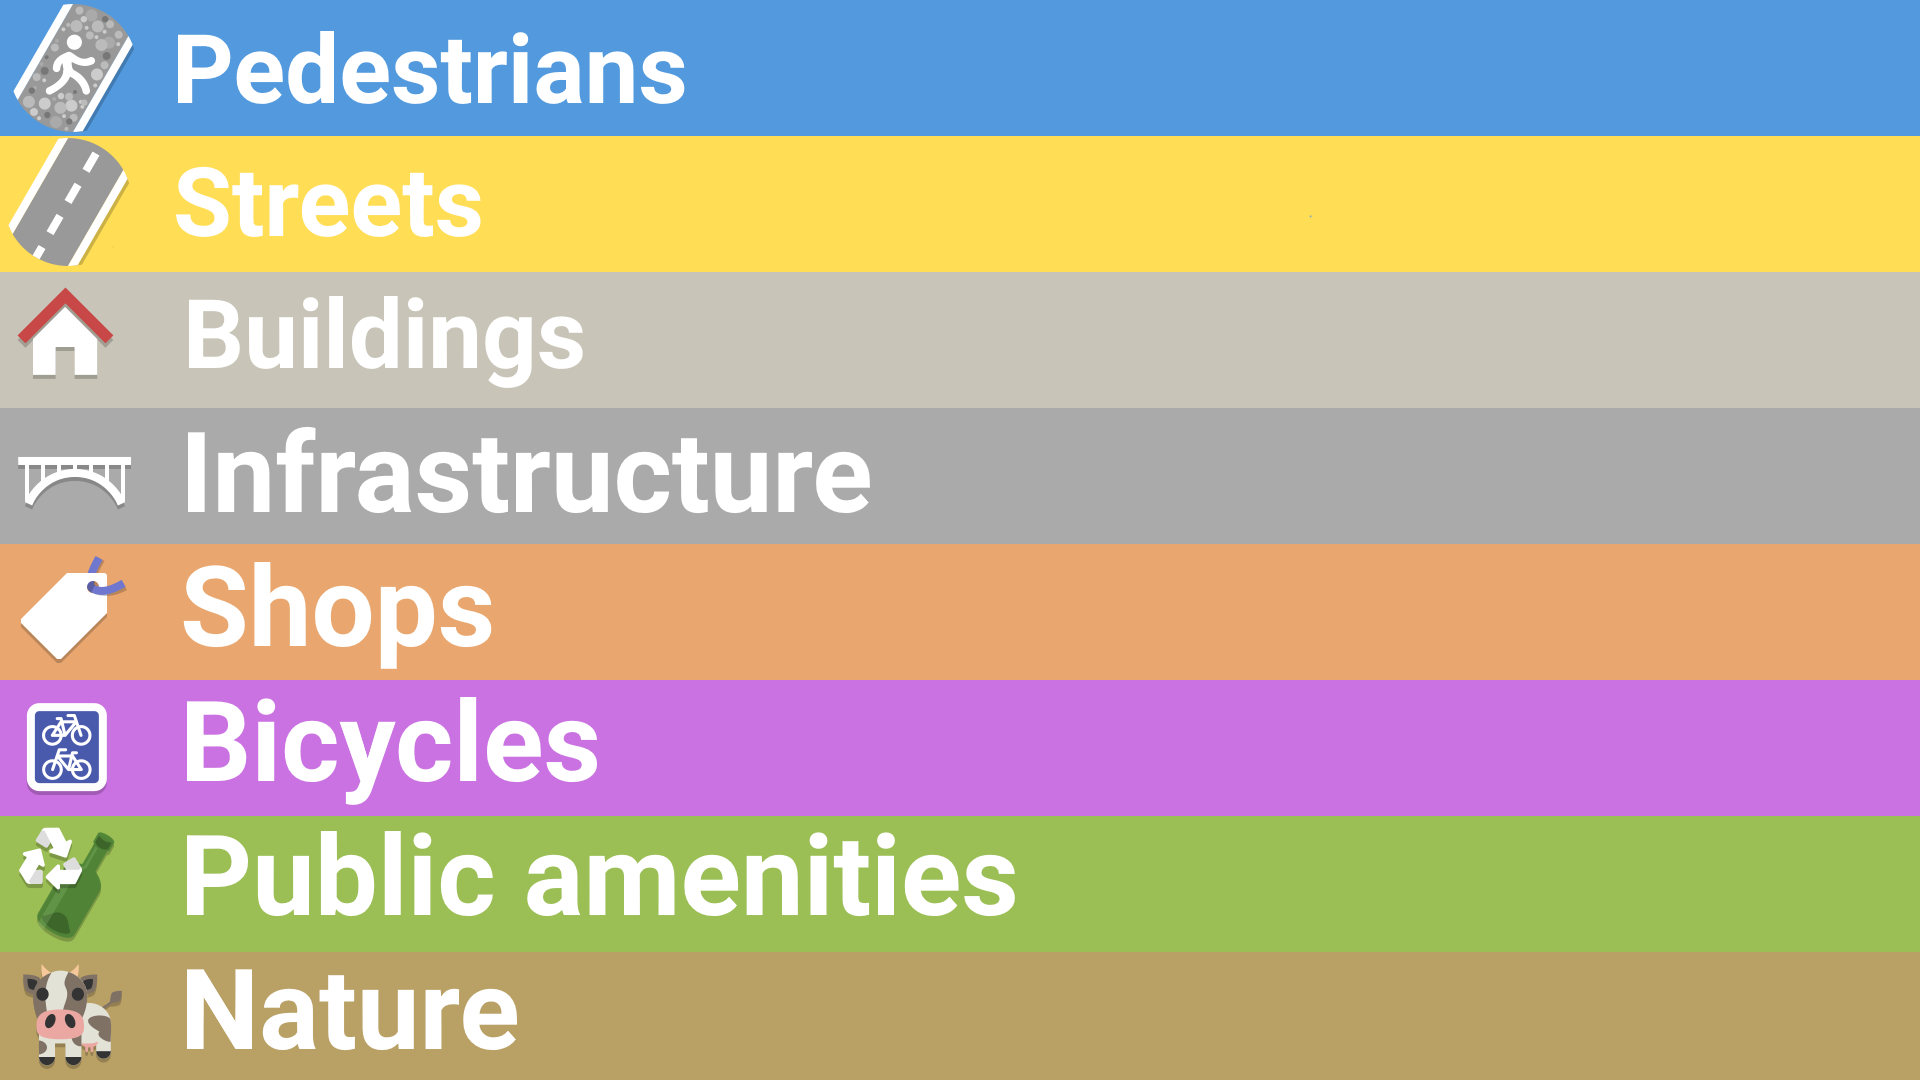
In StreetComplete, each quest has a color that assigns it to a rough category. The categories are the following:
- Blue represents footpaths and pedestrians.
- Yellow represents streets and cars
- Light gray (beige?) represents buildings
- Dark grey represents
man_made, so roughly “infrastructure” - Orange is for stores
- Pink represents bicycles
- Green is for public facilities like benches and trash cans
- Brown represents nature
Here is the distribution as a graph:
And here as a table:
| Single Color | Total | Percent | |
|---|---|---|---|
| Light Brown | 91112 | 13975938 | 0.65% |
| Gray | 109326 | 13975938 | 0.78% |
| Orange | 307434 | 13975938 | 2.20% |
| Green | 391304 | 13975938 | 2.80% |
| Pink | 585953 | 13975938 | 4.19% |
| Yellow | 2963361 | 13975938 | 21.20% |
| Blue | 4697256 | 13975938 | 33.61% |
| Light Gray | 4830192 | 13975938 | 34.56% |
Which quests are solved the most/least often?
Here is a graph showing the 3 most frequently solved quests, as well as the quests that have been solved under 100 times overall by all users:
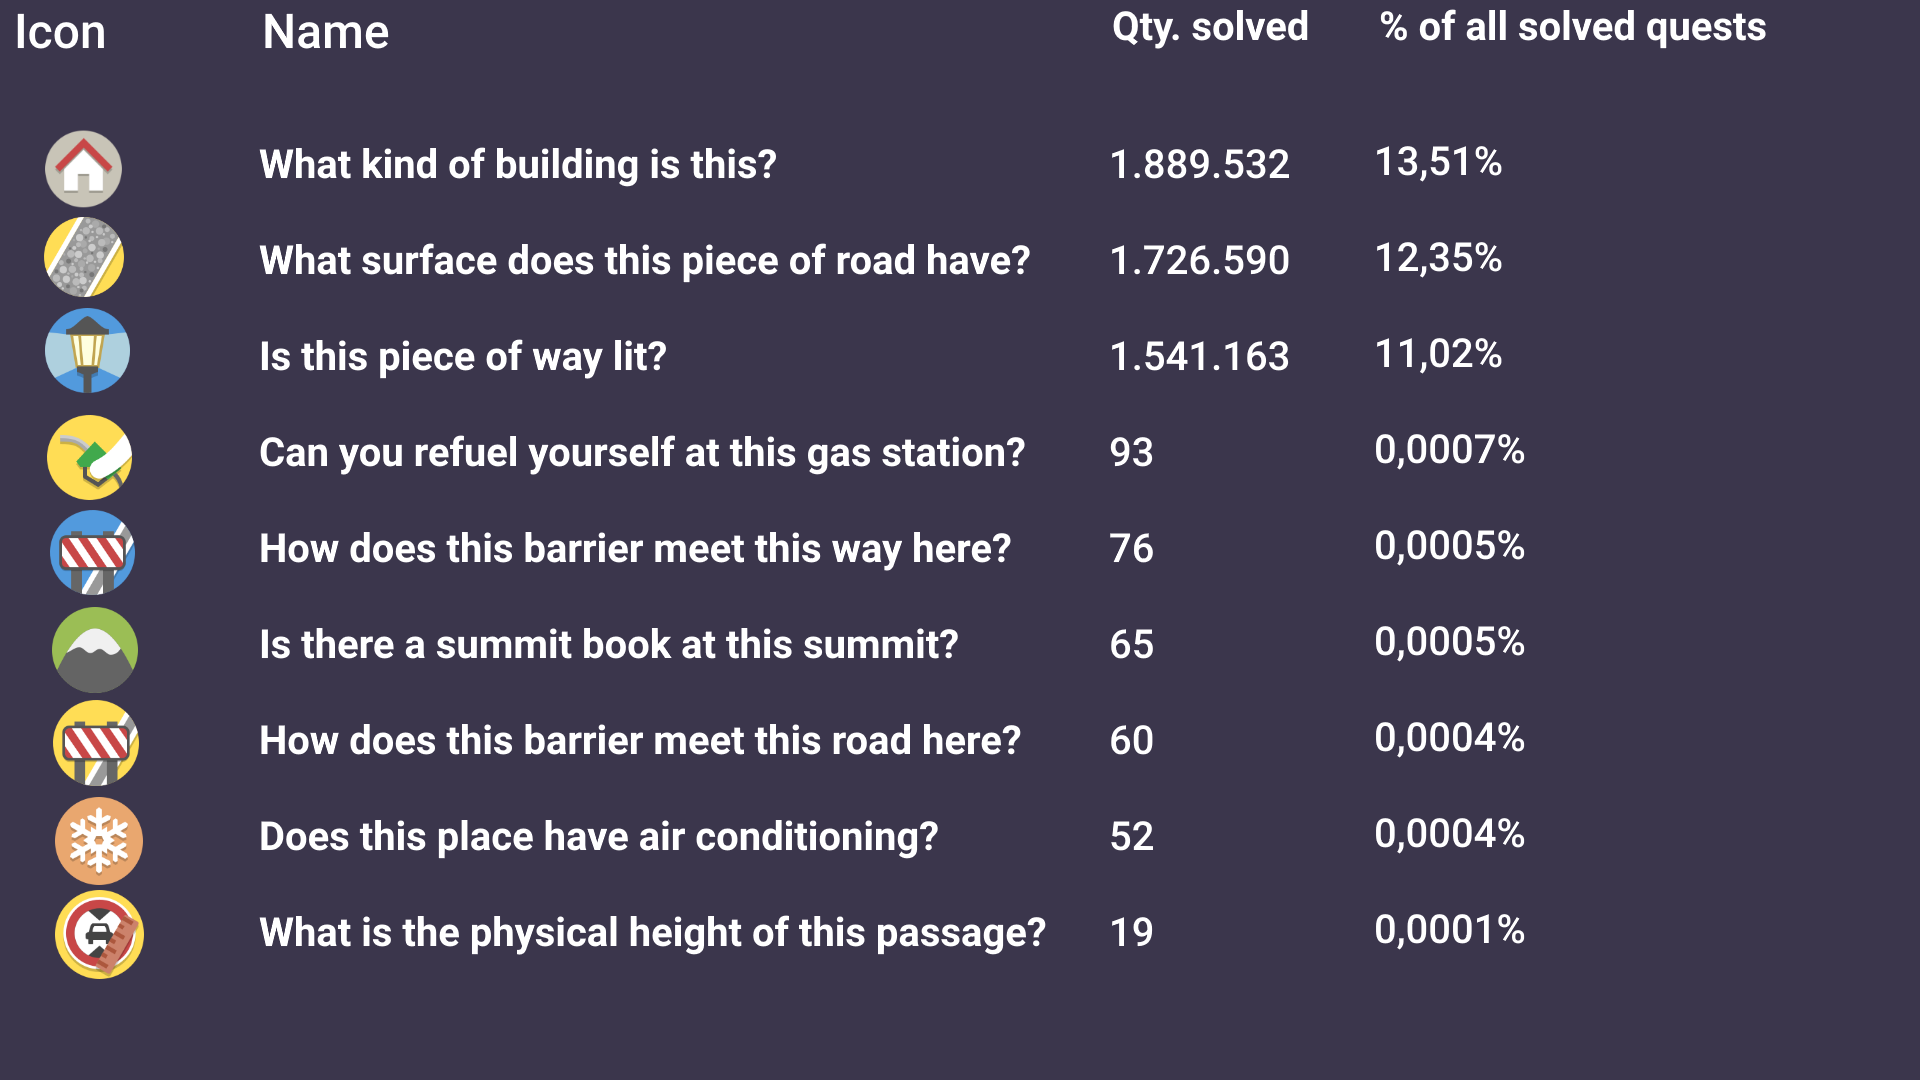
I think the quests with extremely few solutions can all be explained relatively easily:
- “Is it possible to refuel at this gas station itself?” is not shown in Germany - which is very strongly represented in OSM and StreetComplete.
- “Is there a summit book at this summit?” has probably not been answered so often because, on the one hand, there are not so many summits. For another, running through a city with StreetComplete is one thing, but climbing mountain peaks with StreetComplete is something else :D
- The barrier-quests, air-conditioning-quest and physical-height-quest are all relatively new and probably therefore hardly answered yet. The air conditioning quest is disabled by default, and the physical height quest is in last place in my opinion, because you have to use the AR measurement tool for it, which not all phones have.
Here is another graph that shows some more quests with their respective percentages:
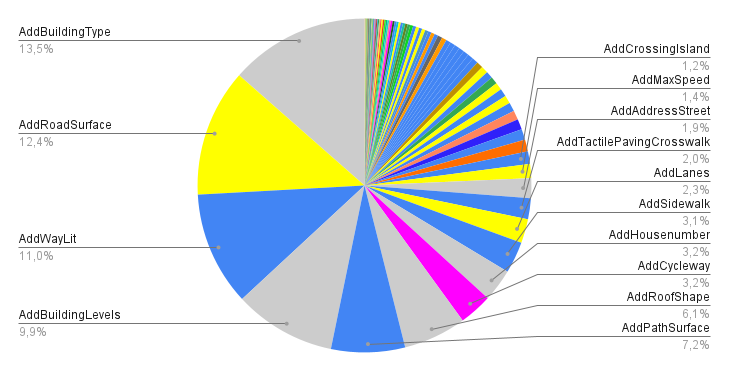
And here is the whole list of quests in ascending order by the number of their solutions:
| Quest-ID | Number solved | All solved quests | Proportion of this quest in all solutions |
|---|---|---|---|
| AddMaxPhysicalHeight | 19 | 13975938 | 0,0001% |
| AddAirConditioning | 52 | 13975938 | 0,0004% |
| AddBarrierOnRoad | 60 | 13975938 | 0,0004% |
| AddSummitRegister | 65 | 13975938 | 0,0005% |
| AddBarrierOnPath | 76 | 13975938 | 0,0005% |
| AddFuelSelfService | 93 | 13975938 | 0,0007% |
| AddAcceptsCash | 122 | 13975938 | 0,0009% |
| AddPoliceType | 126 | 13975938 | 0,0009% |
| AddCyclewayWidth | 149 | 13975938 | 0,0011% |
| AddTrafficCalmingType | 214 | 13975938 | 0,0015% |
| AddWheelchairAccessToiletsPart | 376 | 13975938 | 0,0027% |
| CheckOpeningHoursSigned | 380 | 13975938 | 0,0027% |
| AddFerryAccessPedestrian | 389 | 13975938 | 0,0028% |
| AddFerryAccessMotorVehicle | 454 | 13975938 | 0,0032% |
| AddStileType | 502 | 13975938 | 0,0036% |
| AddBarrierType | 631 | 13975938 | 0,0045% |
| AddCameraType | 717 | 13975938 | 0,0051% |
| AddBikeParkingFee | 756 | 13975938 | 0,0054% |
| AddWheelchairAccessOutside | 756 | 13975938 | 0,0054% |
| AddStreetParking | 771 | 13975938 | 0,0055% |
| AddLevel | 802 | 13975938 | 0,0057% |
| AddBikeParkingAccess | 938 | 13975938 | 0,0067% |
| AddChargingStationOperator | 992 | 13975938 | 0,0071% |
| AddReligionToPlaceOfWorship | 1027 | 13975938 | 0,0073% |
| AddRoadWidth | 1032 | 13975938 | 0,0074% |
| AddMotorcycleParkingCapacity | 1060 | 13975938 | 0,0076% |
| AddIsBuildingUnderground | 1102 | 13975938 | 0,0079% |
| AddSelfServiceLaundry | 1169 | 13975938 | 0,0084% |
| AddClothingBinOperator | 1313 | 13975938 | 0,0094% |
| AddBusStopRef | 1335 | 13975938 | 0,0096% |
| SpecifyShopType | 1354 | 13975938 | 0,0097% |
| AddIsDefibrillatorIndoor | 1388 | 13975938 | 0,0099% |
| AddSuspectedOneway | 1501 | 13975938 | 0,0107% |
| AddAtmOperator | 1502 | 13975938 | 0,0107% |
| AddInternetAccess | 1515 | 13975938 | 0,0108% |
| AddDrinkingWater | 1673 | 13975938 | 0,0120% |
| AddChargingStationCapacity | 1910 | 13975938 | 0,0137% |
| AddPostboxRef | 1919 | 13975938 | 0,0137% |
| AddInformationToTourism | 2113 | 13975938 | 0,0151% |
| AddPostboxRoyalCypher | 2151 | 13975938 | 0,0154% |
| AddBabyChangingTable | 2202 | 13975938 | 0,0158% |
| AddReligionToWaysideShrine | 2240 | 13975938 | 0,0160% |
| AddOrchardProduce | 2315 | 13975938 | 0,0166% |
| AddGeneralFee | 2448 | 13975938 | 0,0175% |
| AddCarWashType | 2455 | 13975938 | 0,0176% |
| AddToiletAvailability | 2519 | 13975938 | 0,0180% |
| AddMotorcycleParkingCover | 2638 | 13975938 | 0,0189% |
| AddBicycleBarrierType | 2994 | 13975938 | 0,0214% |
| DetermineRecyclingGlass | 3040 | 13975938 | 0,0218% |
| CheckShopType | 3736 | 13975938 | 0,0267% |
| AddWheelchairAccessPublicTransport | 3834 | 13975938 | 0,0274% |
| AddOneway | 4034 | 13975938 | 0,0289% |
| AddHalal | 4192 | 13975938 | 0,0300% |
| AddVegan | 4536 | 13975938 | 0,0325% |
| AddKosher | 5104 | 13975938 | 0,0365% |
| AddFireHydrantDiameter | 5136 | 13975938 | 0,0367% |
| AddWheelchairAccessToilets | 5293 | 13975938 | 0,0379% |
| AddSport | 5531 | 13975938 | 0,0396% |
| AddBoardType | 5706 | 13975938 | 0,0408% |
| AddPicnicTableCover | 6012 | 13975938 | 0,0430% |
| AddBusStopName | 6301 | 13975938 | 0,0451% |
| AddRecyclingType | 7075 | 13975938 | 0,0506% |
| AddToiletsFee | 7367 | 13975938 | 0,0527% |
| MarkCompletedBuildingConstruction | 7492 | 13975938 | 0,0536% |
| AddFireHydrantPosition | 9948 | 13975938 | 0,0712% |
| AddRecyclingContainerMaterials | 11610 | 13975938 | 0,0831% |
| AddVegetarian | 11861 | 13975938 | 0,0849% |
| AddFireHydrantType | 11906 | 13975938 | 0,0852% |
| AddBridgeStructure | 12060 | 13975938 | 0,0863% |
| AddCrossing | 16934 | 13975938 | 0,1212% |
| AddPostboxCollectionTimes | 17080 | 13975938 | 0,1222% |
| AddBollardType | 18123 | 13975938 | 0,1297% |
| AddPitchLit | 19606 | 13975938 | 0,1403% |
| AddRailwayCrossingBarrier | 20071 | 13975938 | 0,1436% |
| AddBikeParkingType | 20437 | 13975938 | 0,1462% |
| AddPitchSurface | 22116 | 13975938 | 0,1582% |
| AddMaxWeight | 22556 | 13975938 | 0,1614% |
| AddCyclewaySegregation | 25751 | 13975938 | 0,1843% |
| AddBikeParkingCapacity | 26817 | 13975938 | 0,1919% |
| AddProhibitedForPedestrians | 27273 | 13975938 | 0,1951% |
| AddCyclewayPartSurface | 28265 | 13975938 | 0,2022% |
| AddShoulder | 28278 | 13975938 | 0,2023% |
| AddFootwayPartSurface | 28794 | 13975938 | 0,2060% |
| AddBikeParkingCover | 31671 | 13975938 | 0,2266% |
| AddPathSmoothness | 33433 | 13975938 | 0,2392% |
| AddPlaygroundAccess | 35503 | 13975938 | 0,2540% |
| MarkCompletedHighwayConstruction | 40526 | 13975938 | 0,2900% |
| AddStepCount | 41660 | 13975938 | 0,2981% |
| AddTracktype | 41834 | 13975938 | 0,2993% |
| AddKerbHeight | 42755 | 13975938 | 0,3059% |
| AddMaxHeight | 43728 | 13975938 | 0,3129% |
| AddRoadSmoothness | 44434 | 13975938 | 0,3179% |
| AddTactilePavingKerb | 44713 | 13975938 | 0,3199% |
| AddPlaceName | 46825 | 13975938 | 0,3350% |
| AddStepsIncline | 49162 | 13975938 | 0,3518% |
| AddPowerPolesMaterial | 62784 | 13975938 | 0,4492% |
| AddWheelchairAccessBusiness | 63226 | 13975938 | 0,4524% |
| AddTrafficSignalsVibration | 63457 | 13975938 | 0,4540% |
| AddTrafficSignalsSound | 69883 | 13975938 | 0,5000% |
| AddBusStopLit | 70486 | 13975938 | 0,5043% |
| AddHandrail | 72727 | 13975938 | 0,5204% |
| AddTrafficSignalsButton | 75446 | 13975938 | 0,5398% |
| AddStepsRamp | 77822 | 13975938 | 0,5568% |
| AddBinStatusOnBusStop | 82291 | 13975938 | 0,5888% |
| AddForestLeafType | 88295 | 13975938 | 0,6318% |
| AddRoadName | 93765 | 13975938 | 0,6709% |
| AddBenchStatusOnBusStop | 94389 | 13975938 | 0,6754% |
| AddBenchBackrest | 98525 | 13975938 | 0,7050% |
| AddParkingFee | 100644 | 13975938 | 0,7201% |
| AddBusStopShelter | 107404 | 13975938 | 0,7685% |
| AddParkingType | 108408 | 13975938 | 0,7757% |
| AddTactilePavingBusStop | 119748 | 13975938 | 0,8568% |
| CheckExistence | 124524 | 13975938 | 0,8910% |
| AddParkingAccess | 141111 | 13975938 | 1,0097% |
| AddCrossingType | 145072 | 13975938 | 1,0380% |
| AddOpeningHours | 160341 | 13975938 | 1,1473% |
| AddCrossingIsland | 170003 | 13975938 | 1,2164% |
| AddMaxSpeed | 190915 | 13975938 | 1,3660% |
| AddAddressStreet | 268936 | 13975938 | 1,9243% |
| AddTactilePavingCrosswalk | 283199 | 13975938 | 2,0263% |
| AddLanes | 325145 | 13975938 | 2,3265% |
| AddSidewalk | 427435 | 13975938 | 3,0584% |
| AddHousenumber | 441068 | 13975938 | 3,1559% |
| AddCycleway | 448175 | 13975938 | 3,2068% |
| AddRoofShape | 850171 | 13975938 | 6,0831% |
| AddPathSurface | 999441 | 13975938 | 7,1512% |
| AddBuildingLevels | 1379383 | 13975938 | 9,8697% |
| AddWayLit | 1541163 | 13975938 | 11,0273% |
| AddRoadSurface | 1726590 | 13975938 | 12,3540% |
| AddBuildingType | 1889532 | 13975938 | 13,5199% |
What can we take away from these statistics?
We can see very well that StreetComplete is quite undiversified in terms of its use and its users. Few people are responsible for the majority of all solved quests. Mainly StreetComplete is used to add details to houses, streets and roads. This doesn’t seem too surprising, since a city consists mostly of houses, streets and roads. In this respect, it is not a big deal that a large part of the solved quests are also related to these object types. As for the users, it looks a little different: Of the 5000+ users I examined, 100 are responsible for 30% of all quests solved. And while in the video version of this post I conclude that this is an indication of the not-so-good-looking diversification in OpenStreetMap, I’ve since done some more thinking and come to a different conclusion. You have to count out the power users much more than aligning the other users with them. So the average user doesn’t do proportionally little, but the power users do proportionally a lot. Looking at it this way, StreetComplete has a good user base that contributes relatively evenly to OpenStreetMap.
Discussion
Comment from Strubbl on 13 May 2022 at 11:21
There’s a difference between the app and what your script shows for the stars. I think the cause might be the stars collected before a central DB saved them. I am using different devices and i “lost” stars in the beginnings of the app due to reinstalls or simply using another device.
Comment from Mateusz Konieczny on 14 May 2022 at 06:56
Note that stars may reappear after delay but they are not lost by changing devices.
Comment from Mateusz Konieczny on 14 May 2022 at 06:58
Note that it is true for editing also with other editors (with JOSM to even greater degree if someone fails to exclude imports).
Comment from Mateusz Konieczny on 14 May 2022 at 07:22
Thanks for analysis!
Is it possible that it counts users who solved now disabled quests when they were enabled by default? For example roof shape quest was disabled recently.
Comment from Strubbl on 14 May 2022 at 07:50
They are lost, because they were collected before the stars were saved in a remote location. I mean in the very early version of SC (<v10).
Comment from Mateusz Konieczny on 15 May 2022 at 07:28
Stars are not exactly saved - all edits ever made are parsed based on public changeset info.
But maybe SC cannot parse such old edits?
Comment from Strubbl on 15 May 2022 at 09:37
What do you mean with “Stars are not exactly saved”? IMO the number of quests solved, “stars”, are saved centrally on a server from WNO. This was introduced with SC v. X. Old changesets by SC with version <X are not parsed. If you still had the stars in your app when version X was introduced, they were used as start value instead of 0 stars.
When you reinstalled SC <v. X you started again with 0 stars although you might have solved quests already with the old installation. Stars were not synced from anywhere when setting up the app.
Comment from Mateusz Konieczny on 15 May 2022 at 12:47
It is recorded in changeset tags, not on central server operated by Tobias. Sooner or later statistics server will be restarted and reload data from changesets by parsing past user edits.
At the same time data displayed by SC right now is supplied by this central server operated by Tobias.
This is likely to be true.
Comment from westnordost on 15 May 2022 at 21:19
But still not true. All changes ever done with SC beginning with v0.1 are included in the statistics shown in the app.
Comment from Strubbl on 15 May 2022 at 21:45
Then, the script’s counting is not correct as it shows a higher number than SC. E.g. for me the quest AddIsDefibrillatorIndoor shows in SC 19 and the script 21.
Comment from westnordost on 15 May 2022 at 22:59
I think the discrepancy can be explained by this:
https://github.com/streetcomplete/sc-statistics-service/blob/master/classes/ChangesetAnalyzer.class.php#L36-L69
When you solve a quest, then undo a quest, then solve it again (differently), that’s 3 changes. StreetComplete only counts this as one. Wieland’s script probably counts this as 3 (because it is easier and the difference will usually not be that high).
Comment from Mateusz Konieczny on 25 May 2022 at 10:54
For disabled quests https://raw.githubusercontent.com/matkoniecz/StreetComplete_usage_changeset_analysis/master/disabled_quests.yaml and https://github.com/matkoniecz/StreetComplete_usage_changeset_analysis/blob/master/collect_info_about_quests_disabled_by_version.py that I just made may be useful.