
A few weeks back I gave a talk in London which was a sneak preview of my “Diagrams Of OpenStreetMap” SoTM talk Yes! I’m heading to Japan for the conference soon! I’m the only one from the London crowd going, so this wasn’t a spoiler for anyone in the audience, but this diary entry is a small spoiler. I thought I’d give some details of just one diagram from the talk. This one:

You may recognise it although I think its “Component Overview” home on the wiki is a bit hidden away these days. But anyway you wouldn’t recognise the right hand side because this is newly redrawn as of last night! In fact I’ve done a few iterations which I am unveiling as part of the talk. The left hand side editors were given an update, but last night I was tackling the more tricky right hand side where we try to show different rendering stacks and map display approaches available and used in the wider ecosystem.
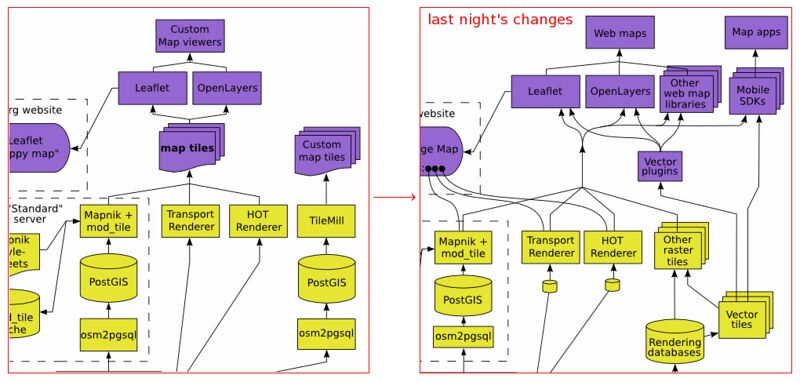
Up until last night this simply described one possible “TileMill” set-up. That technology is a bit obsoleted by Mapbox Studio these days, but more importantly it’s only one of a range of new tools. So to iterate on this, redrawing a little bit, I’ve aimed for a more high level summary of tech concepts on the right.
A key new technology concept which is very much part of this landscape now is “vector tiles”. Been around for a long time of course, but these days lots of folks are making very practical use of OSM vector tiles within commoditised rendering stacks and other tools. Time to bring it into the diagram. Hopefully I’ve connected things up reasonably correctly. Vector tiles can be used as a data source fed into good old raster tile rendering, but they can also be fed direct to the browser to be displayed there instead of raster tiles. That happens usually still with the use of LeafletJS via tools which I’ve collectively called “Vector plugins”
That’s my understanding. But I’m a little unsure of the details. The level of abstract summarisation here is avoiding the details, but I would like to see a diagram which shows more specific technologies. Probably a different diagram, rather than trying to add it all on here. Something with boxes for: Mapbox studio, Mapbox GL, Tangram, Tangram Play, ThunderForest’s stack, OpenMapTiles stack, and the different vector tile formats, schema formats, style sheet formats, etc, etc. A layered diagram summarising all things vector tiles. That’s a difficult diagram for me to draw, because I am shaky on the details and generally finding some of the linkages unclear, but maybe that’s a clue that this will be a useful diagram!
Maybe I’ll create something myself in time for the conference, but maybe not. Do let me know if you know of any existing diagrammatic efforts in this area. In fact let me know if there’s any diagrams you think deserve a mention, whether on similar tech topics or something completely different. I’m ruling out auto-generated “visualisations” from my definition of “diagrams”, but other than that it’s wide open to all sorts, and I’m hoping to give a bit of a tour of a wide variety of “diagrams of OpenStreetMap”.
Discussion
Comment from Andy Allan on 27 July 2017 at 13:21
Just a minor point, but the OpenCycleMap and Transport layers both have the same rendering stack, so I’m not sure why there’s a separate “Transport Renderer” on there. Both layers are an osm2pgsql -> PostGIS -> vector tiles -> raster tiles type of stack.
Comment from Harry Wood on 28 July 2017 at 14:28
yes. Well OpenCycleMap is missing I noticed after writing this. In the interests of compactness we could probably just change “Transport Renderer” to “OpenCycleMap & Transport Map”.
The other thing I added was connections to the “Front page map” from these things. This is the justification for including these specific renderers on the diagram at all. They’re the featured tile layers.
The little database symbol below Transport Renderer, I suppose I’m thinking this vaguely represents a datastore of some kind, but this is the ThunderForest rendering stack. It could be expanded out. All gets a lot less compact then though. Then we’re going towards the other diagram I want, which would show different types of vector tiles.