President Ferdinand R. Marcos Jr. on strengthening support for teachers and advancing education at #SONA2024 #Mapper
Users' Diaries
Recent diary entries
I wish an Irish wristwatch.
P.S. The wristwatch shall be wish-washed

I am mapping every day, but i am unable to write a diary entry for every day i map. due to limited internet access and being on the move most of the time.
During the past 4 days, including today, i have mapped Villages Mesul, Cerjan, Bishqem and Papër and i have done a lot of mapping in Kosovo.
I have also gotten some private message these days to whom i have been unable to respond, so i ask you to bear with me. I will be back home in a week and will catch up with you all. Thanks a lot for contributing on mapping Albania! <3
“#100villagesin100days “
13 luglio partenza da Makarska e arrivo a Sumartin (Isola di Brac)

Test hihi
Hello, I am logus and I am from Vietnam. It would be amazing if all of us from South East Asia collaboratively map for OpenStreetMap’s 20th birthday at August 9th. Right now, I am currently mapping Hanoi’s center at here. If you are interested, do leave a comment below. Thank you!
Good morning!
This is my first diary entry. I am new to OSM and have a lot of learning and growth to do. I have to say I knew nothing about OSM and am absolutely blown away by how many companies use OSM in their mapping efforts. Truly awesome!
I am starting out building a interactive eruv map using OSM. I am getting lot of help and I am learning all the code words of the OSM community. Learning what for instance nods are points, I think they are called wazes or lines, and relations are a combinations of points and lines. Learning to Tag as well. I am also learning and trying to learn daily the LearnOSM website. Going through the tutorials are very good. I am enjoying doing it, yes it is frustrating at times but that is learning.
I am building this eruv map for my community and looking to embed it on the Synagogues website. Learning right now I am learning about the editor and how to place points and lines.
I will keep posting every so often my wins, loses, and how it worked for me.
by:
New OSMer
Jason
Posted by Cidomo Beruntung on 19 July 2024 in English.
On May 24, 2024, I led an “Introduction to OpenStreetMap (OSM)” training session at the Geography Department of the University of Laos in Vientiane. The session was organized with the help of Professor Sonnasack Phaipasith, who provided translation support and organized the venue and invited his students. We had 15 participants, all students of Geography - eight women and seven men.
This training was part of my assignment with the Humanitarian OpenStreetMap Team’s (HOT’s) Open Mapping Hub - Asia Pacific (AP Hub) Guru Fellowship program. The Guru Fellowship program is a program aiming to engage with and upskill OSM mappers to fully utilize their knowledge and experience in advancing the Open Mapping movement in the region. Within this Open Mapping Guru Fellowship program, I also organized a Happy Hours OSM mapping meetup in Vientiane as well as 2 online trainings about “Mapping Relations” and “Good practices of Tagging Names in OSM”.

For this in-person “Introduction to OpenStreetMap” training we met from 8:30 AM to 12:30 PM at the University of Lao. We covered the basics of OpenStreetMap, how to use it effectively and explored how mapping and OSM skills can benefit young Geographers in building their career.
The training covered the following topics:
-
Understanding OpenStreetMap, Its Data, and Community We started with an overview of OpenStreetMap, including its website, wiki, and community. We also compared Google Maps with OSM to highlight their similarities and differences.
-
Accessing and Using OpenStreetMap I demonstrated various ways to access and use OpenStreetMap data. Participants explored the OSM website, Organic Maps, the QGIS plugin (quickOSM), the HOT export tool, Geofabrik, and Overpass Turbo. This session showed how versatile and accessible OSM data can be.
-
Contributing to OpenStreetMap One of the key parts of the training was learning how to contribute to OpenStreetMap using the iD editor and briefly showed the JOSM editor. These tools help users add and update map data, making it easy to contribute to the community.
-
Local Initiatives and Community Involvement We also talked about local OSM initiatives and how participants can get involved. I shared information about the Lao OSM community and HOT’s work, encouraging everyone to contribute to these efforts.
-
Skills and Opportunities for GIS Professionals The session wrapped up with a discussion on the skills needed and opportunities available for GIS professionals in Laos. This part was important for those looking to use their new OSM skills in their careers.
The “Introduction to OpenStreetMap (OSM)” training at the University of Laos was a great success and fun for everybody. With support from the Geography Department esp. Mr. Sonnasack Phaipasith, the participants learned about OSM and gained some practical skills they can use in the mapping community and their professional lives.
This training was a valuable step towards building a more connected mapping community in Laos and beyond.
Posted by Cidomo Beruntung on 19 July 2024 in English.
Getting to know OpenStreetMap (OSM)
I love maps. Since I was a kid, I was fascinated by the old atlases and maps I found in my grandfather’s drawers. I could spend hours learning about countries’ borders, historic events, and the world through those thematic and topographic pieces of art and science.
Circumstances had it that eventually I ended up with a Masters Degree in Geography, unleashed onto the professional world, trying to make some positive contributions, some might say, “to change the world”, on the beautiful island of Lombok, Indonesia.
I still remember, when back in 2008, my colleague showed me an article about a crazy project to make a free map of the world, basically by using GPS tracks as the main data source – high resolution satellite imagery as we know it now, was not yet accessible. Crazy idea, impossible, overambitious, were a few thoughts that popped up. Though, “why not give it a try” and add a few roads and places in my neighborhood. I don’t think those few edits made a big difference to OSM – but it thought me of how to use and contribute to OSM.
Becoming an OSM contributor
The following year I ended up living and working in the town of Putussibau, Kapus Hulu District. Take a dart, throw it somewhere onto the middle of a map of Borneo, the biggest Island in Indonesia, and if you slightly missed the exact middle a little bit to the north-west - that’s where I found myself. Surrounded by amazing nature, amid local Dayak, Iban, Punan and Malayu as well as other Indonesians who had moved there more recently from other parts of the archipelago, I was teaching GIS and conservation, mapping forests, customary boundaries and the manifestations of an increasing human footprint there – road infrastructure, oil palm plantations, gold mining areas and the like.
While my maps slowly filled up with data of villages, roads, rivers, online maps such as Bing and Google had very little to say about Putussibau and Kapus Hulu, mostly just showing a huge expanse of – “empty, nothing”.
Here is where my OSM journey really started. I figured out how I could include my data into OSM, started to digitize more rivers, roads and when I left two years later OpenStreetMap had probably the best publicly available map data for Putussibau Town and many other areas in Kapuas Hulu. Somehow it felt good to put “a place onto the map”, to be able to fill some void.
The idea of OSM, to create a free map of the world suddenly did not sound so crazy anymore – I realized that if many people collaborate with a common goal, the seemingly impossible is suddenly within reach.
The value of collaboration and community
Back on Lombok, I started to share my OSM experiences, encouraged and helped others to also share their data with the OSM community and continued to map here and there. It was very helpful that at the same time Microsoft started to allow the use of their Bing satellite imagery to trace features for OSM – as it made contributing to OSM much easier and allowed to also excite non-Geographers or mapping people to become part of the OSM community. OSM also became a good way to start teaching about mapping and GIS and give students the feeling that after a relatively short training, they could already create something useful – not just some training exercise data, to be discarded afterwards as in my previous mapping trainings.
While working on Lombok Island and the province on East Nusa Tenggara I met with people from the Humanitarian OpenStreetMap Team (HOT), who were supporting projects, focusing on rural development in eastern Indonesia and disaster risk reduction in Jakarta through training mappers, supporting mapping missions and developing tools and leveraging the OSM ecosystem.
As a self-taught hobby OSM’ler this was exciting and I was lucky enough to find ways to become more deeply involved in some of their and their partners’ project activities, gaining a much better insight of OSM, see how OSM can be used by government agencies, communities and others to really make a change and also experience some of the many challenges, meeting inspiring people and making new friends.
What I also like about OSM is that while easy and simple to contribute and use, below the hood, it is nevertheless a complex system of data infrastructure, mapping and data access tools, evolving mapping standards & best practices and last but not least, it’s a community of like-minded people each with their own strengths but sharing the common interest for free and open data and mapping. There is always something new to learn. Engaging with OSM taught me a lot and pushed me to expand my understanding of GIS and working with data and within a community.
Making and impact through sharing data with OSM
When I eventually left Indonesia for Myanmar, I made sure I was able to share as much relevant data as possible from my work with OSM, e.g. adding a wealth of thoroughly mapped roads and points of interest for Mataram, Lombok’s biggest city, and parts of north-western Lombok. And if you find yourself sipping a cocktail at a beach bar on the (in)famous Gili Trawangan Island, keep an eye on the street signs. You’ll likely see roads named after local sealife—names created, agreed on and made official by the local community, with assistance from Gili Ecotrust and partners, using OSM data and derived maps.
Very often, so-called development projects go to great efforts to create a lot of quality geospatial data. Unfortunately, very often, at the end of those projects those data disappear in data archives accessible to only a few, are forgotten or lost entirely. With a little extra effort, some of those data could (and should) be made available to the public. It would be effort well spend to filter out sensitive data, remove less relevant project specific data, document and transform the remaining data and share those with OSM or other open data platforms.
OSM in Myanmar
I was fortunate to arrive in Myanmar at a time when the country’s fortunes seemed to finally be heading in the right direction. Astonishing reforms were initiated, bringing a new sense of development, openness and democracy, and improving the prospects of the country and the lives of millions.
With people just starting to get access to internet, there was obviously no vibrant Myanmar OSM community yet, nor did many people use (or know how to make use of) maps anyway. Nevertheless, things changed when internet became more and more affordable and with the likes of Grab “forcing” people, or at least the cab-drivers, to use maps. Organizations and individuals increasingly mapping in and using OSM.
Working initially for a conservation NGO in the country, I experienced first-hand the scarcity of quality large scale geospatial data. MIMU, a UN organization did and still does a great job trying to provide medium and small scale geospatial data, but if you are looking for geodata to make maps and conduct analysis on anything going beyond township level scale, the only options you had was illegally using topographic map scans “leaked” from a military affiliated government department or outdated topographic maps produced by the colonial government a century ago. For large scale map data, suitable to make maps on village tract or site level, you were completely on you own.
When, after some years, changing jobs to working on a project with a strong focus on geospatial data with the Centre for Development and Environment (CDE), new opportunities to more strongly reengage with OSM opened.
CDE jointly with Fauna & Flora International (FFI) translated essential OSM training materials from learnOSM, the Official HOT OSM learning materials into Myanmar https://learnosm.org/my and we provided funding and technical assistance to Phandeeyar, a Yangon based technology seed accelerator to organize and support the emerging Myanmar OSM and open data community. Furthermore, I was able to provide numerous OSM beginner trainings in Yangon, the largest city in Myanmar, and in the coastal city of Dawei, which became my home for several years.
It was always exciting to see how many OSM beginners enthusiastically mapped their home villages and areas they had a personal connection to. Some of them continued to contribute by mapping large areas to the extent that I wondered where they even found the time to do so.
I believe that contributing to OSM is most effective when organized as a community with clear goals in mind. A collaboration between the Red Cross, Missing Maps, CDE, and Phandeeyar to map the city of Mawlamyine in 2018 is a perfect example. https://www.missingmaps.org/blog/2018/09/24/mapping-in-myanmar/
OSM in the face of Myanmar’s new realities
Tragically, Myanmar’s path to progress was abruptly halted. Following the military takeover in February 2021, the country has largely descended into crisis, chaos, and conflict. Poverty has risen sharply, security has severely deteriorated, political freedoms have been significantly reduced, and armed conflict taking place in many parts of the country.
Many, especially young people, have either left the country or joined the resistance. The space for open dialogue has diminished, making ends meet becoming a daily challenge and in the face of reality, the once-ubiquitous smiles of the Myanmar people are becoming increasingly rare. In light of this dire situation, the once-active Myanmar OSM community had largely disintegrated.
Civil society, humanitarian organizations and passionate individuals are trying to provide basic assistance to the most vulnerable people in Myanmar. Having access to reliable maps can help them to be more effective. If access to geospatial data was challenging during Myanmar’s better years, it has only worsened since. While google maps for Myanmar has improved significantly over the last decade and is used widely, its terms-of-use and access limitations severely limit its usability, not to mention the lack of detail and coverage, esp. in rural areas.
I believe that OSM, as the best available open mapping platform offering detailed large-scale geospatial data, becomes even more valuable in such circumstances. As such me and my organization is working to re-activate the Myanmar OSM community, support Myanmar OSM mappers, and collaborate with HOT, e.g. to provide technical assistance and facilitate remote mappers to help improve essential OSM data for Myanmar.
MyOSM, our Myanmar OSM group, has since grown in numbers and skills and it is amazing how much myOSM has already been able to map, improving data on settlement areas, roads, rivers and other features that can be mapped remotely – field mapping for security reasons is currently highly restricted.
HOT’s Open Mapping Hub - Asia Pacific (AP Hub) Guru Fellowship program was instrumental as it provided four myOSM members essential skills for OSM focused training, mapping and validation. Furthermore, joining the 5 months fellowship program fostered a sense of community and belonging to an international group helping each other and joining hands to improve OSM. Equipped with the new skills, we are more confident in our OSM activities and can better share those skills with and help other OSM mappers.
Expanding to Lao PDR
My journey with OSM is far from over. Currently, I am based in Vientiane, the capital of Lao PDR. Access to large scale geospatial data is also a challenge in Laos and unfortunately there is no strong Lao-OSM community yet – with most OSM mapping here done by individuals, mostly foreigners. Though our OSM-Laos group is trying to change this by organizing trainings, outreach activities and smaller mapping missions.
In my case, I helped with a OSM beginner training at the Department of Geography, National University of Lao and organizing a Mappy Hours Event – a mapping meetup for OSM mappers in Vientiane.
Building an active community here may seem challenging, but so did the idea of creating a free map of the world back in the mid-2000s. If we believe in our goals and work together, nothing is impossible.
Happy mapping, everyone!
Posted by Tomio on 18 July 2024 in Brazilian Portuguese (Português do Brasil).
Importação de dados de Brusque / SC
Contatei o Setor de Geoprocessamento da Prefeitura de Brusque, solicitando a gentileza de fornecer dados das edificações e números de porta, da cidade, para melhorar as informações no OSM.
Fui atendido pela Camila da Silva, Coordenadora do GeoBrusque.
Ela consultou o seu Diretor e ambos autorizaram e forneceram arquivos digitais (shp):
- Limite bairros
- Edificações (geometrias)
- Números de porta
Iniciei os trabalhos, ajustando manualmente cada ponto de cada um dos bairros, conforme o arquivo oficial enviado.
Posteriormente, será feita a importação e conflação com os dados existentes no OSM.
Esta etapa de importação será detalhada numa página wiki, que estará sendo criada e reportada aqui.
Também serão disponibilizados os links com os arquivos.
Esta publicação é para dar publicidade à excelente contribuição da Prefeitura de Brusque / SC, em colaborar com o OSM.
Também, demonstrar que existem órgãos públicos de qualidade nesse país, que participam dos projetos que trazem ganhos para a população.
Parabéns pela atitude do Município de Brusque e registro aqui, nossos agradecimentos em nome da Comunidade Openstreetmap Brasil.

These days i am very busy and i have not been able to write a diary entry as I do every day, but i have mapped some villages and improved some already mapped villages. Too tired, to remember the names or go back and look them up. Hopefully ill get some more free time in the next days to make a more detailed diary entry.
“#100villagesin100days #day41&42”

This week, I am attending State of the Map Europe 2024, where I’ll be a speaker on at least two occasions. Because of that, I have been working on material for the conference, and I would like to include it in my development diaries. However, to avoid spoilers, this must obviously be done after the conference :P. Please expect development diary #15 to be published shortly after SOTM EU, which ends on Sunday. I will also try to get the video recording of my talks in case you miss them. Cheers 🦀!

Are you familiar with the OpenStreetMap Statistics created by Piebro? It’s a handy tool that analyzes OSM changeset files and creates graphs from various perspectives.
- https://piebro.github.io/openstreetmap-statistics/
- https://github.com/piebro/openstreetmap-statistics

The project’s README also indicates that analysis can be performed for individual countries or regions. I analysed the Japanese region in my local environment, so I’ll summarize the procedure.

My Environment
- MacOS
- Python 3.9
Data Preparation
Clone Piebro's git repository to your local machine:
$ git clone https://github.com/piebro/openstreetmap-statistics.git
$ cd openstreetmap-statistics

Install osmium-tool using Homebrew:
$ brew install osmium-tool

Prepare the virtual environment:
$ python3 -m venv .venv

Install necessary dependencies:
$ pip3 install -r requirement.txt
Obtaining the OSM Changeset File
Piebro’s README uses torrent. Using torrent should result in lower network load, so it’s preferable if possible.
$ rm $(ls *.osm.bz2)
$ wget -N https://planet.openstreetmap.org/planet/changesets-latest.osm.bz2
Obtain the Poly File for the Target Region
Download the poly file for the target region from the Geofabrik site.
$ wget -N https://download.geofabrik.de/asia/japan.poly
Extracting the Changeset File
Use a poly file to extract the target region from the changeset-latest file. Please use the following script for extraction (written by Claude):
https://gist.github.com/nyampire/57360f29be2bff4d74d94e3c5bfa3237
Install shapely 1.8.0.
The latest version 2.0 and later seems incompatible with dependent software.
$ pip3 install shapely==1.8.0
$ wget -N https://gist.githubusercontent.com/nyampire/57360f29be2bff4d74d94e3c5bfa3237/raw/1fa9ded4126b3282af273469225407847cb38ee7/parse-latest.py
$ python3 parse-latest.py [poly.filename] [input.filename] [output.filename]
$ (sample) python3 parse-latest.py japan.poly changesets-latest.osm.bz2 japan-chansegets.osm.bz2
As a result of the script processing, in this example, japan-changesets.osm.bz2 will be output.
Generating Files for the Notebook
The subsequent processing is similar to Piebro’s procedure. I omitted the pv command as it’s only used to monitor progress.
$ rm -r -d temp
$ osmium cat --output-format opl output.osm.bz2 | python3 src/changeset_to_parquet.py temp
$ python3 src/parquet_to_json_stats.py temp
Updating the Notebook
Execute the following in the terminal. You can make it into a shell script and kick it, but it will also work if you paste it directly into the shell.
for notebook in $(find src/questions -name calculations.ipynb); do
    jupyter nbconvert --to notebook --execute "$notebook" --output calculations.ipynb
done
Starting the Local Server
Start a local http server to check. You need to start an http server; otherwise, the graphs won’t display due to CORS issues.
python -m http.server 1010
Access to “http://localhost:1010” to show graphs.
Instead of starting an http server, you should also be able to push to your personal git repository and check from gh-pages.
However, with the steps so far, the remote is set to Piebro’s repository. Please modify it to upload to your own repository.
Posted by nyampire on 18 July 2024 in Japanese (日本語).
Piebroさんが作成したOpenStreetMap Statisticsを知っていますか?
OSMのchangesetファイルを分析して、様々な角度からグラフを作成してくれるとても有益なツールです。
- https://piebro.github.io/openstreetmap-statistics/
- https://github.com/piebro/openstreetmap-statistics
プロジェクトのREADMEでも、それぞれの国や地域を対象に分析を実施することができる、と示されています。 私のローカル環境で、日本地域を対象にした分析を行うことができたので、手順をまとめておきます。
私の環境
- MacOS
- python 3.9
データの準備
piebroさんのgitリポジトリをローカルへクローンします。
$ git clone https://github.com/piebro/openstreetmap-statistics.git
$ cd openstreetmap-statistics

Homebrewを使って、osmium-toolをインストール
$ brew install osmium-tool

virtual environmentの準備
$ python3 -m venv .venv

必要な依存関係をインストール
$ pip3 install -r requirement.txt
OSM変更セットファイルの入手
pirbroさんのREADMEではtorrentを使っています。
torrentのほうがネットワーク負荷は低いはずなので、可能ならばそちらを使ったほうがよいでしょう。
$ rm $(ls *.osm.bz2)
$ wget -N https://planet.openstreetmap.org/planet/changesets-latest.osm.bz2
対象地域のpolyファイルを入手
Geofabrikのサイトから、対象地域のpolyファイルをダウンロードします。
$ wget -N https://download.geofabrik.de/asia/japan.poly
変更セットファイルの切り出し
polyファイルを利用して、changeset-latestファイルから対象地域を切り出します。
切り出しには以下のスクリプトを使ってください。(Claudeに書いてもらいました)
https://gist.github.com/nyampire/57360f29be2bff4d74d94e3c5bfa3237
shapely1.8.0のインストール。
最新版の 2.0以降だと、依存するソフトが対応しないようです。
$ pip3 install shapely 1.8.0
$ wget -N https://gist.githubusercontent.com/nyampire/57360f29be2bff4d74d94e3c5bfa3237/raw/1fa9ded4126b3282af273469225407847cb38ee7/parse-latest.py

$ python3 parse-latest.py [poly.filename] [input.filename] [output.filename]
$ (sample) python3 parse-latest.py japan.poly changesets-latest.osm.bz2 japan-chansegets.osm.bz2
スクリプトの処理の結果として、この例の場合であれば japan-changesets.osm.bz2 が出力されます。
Notebook用ファイルの生成
続く処理はPiebroさんの手順と同様です。
pvコマンドはあくまでも進捗状況の把握のために使われているため、私は省略しました。
$ rm -r -d temp
$ osmium cat --output-format opl output.osm.bz2 | python3 src/changeset_to_parquet.py temp
$ python3 src/parquet_to_json_stats.py temp
Notebookの更新
ターミナルで以下を実行します。
シェルスクリプトにしてKickしてもよいですが、シェルにそのまま貼り付けても動きます。
 for notebook in $(find src/questions -name calculations.ipynb); do
     jupyter nbconvert --to notebook --execute "$notebook" --output calculations.ipynb
 done
ローカルサーバの起動
ローカルでhttpサーバを起動して確認します。
httpサーバを起動しないと、CORSの関係でグラフが表示できません。
python -m http.server 1010
ブラウザから “http://localhost:1010” へアクセスすると、グラフが表示されます。
なお、httpサーバを起動する代わりに、gitの個人リポジトリ等にPushして、gh-pagesから確認することも可能のはずです。
ただし、これまでの手順だと、remoteがpiebroさんのリポジトリになっています。修正して自分のリポジトリにアップロードするようにしてください。
سنگبری یزدانی قم
a
I started contributing some edits to OSM using StreetComplete, it’s nice to be able to help!
Yesterday i received a message from perenniallylate notifying me that he had mapped village 99 on the list, Tremul, and asking me if it was okay for him to map some villages in the upcoming weeks.
I thanked him in private, but also want to thank him publicly for contributing to mapping Albania and putting Albanian villages on the map.
Anyone can map any village from the list, because I can always add more villages to it. It would be amazing if you could send me a message or leave a comment that you mapped it, but even if you do not, it is totally okay.
Today I continued mapping and mapped Kryemadh and the surrounding areas, including villages Kalimash and Shtanë.
“#100villagesin100days #day40 #+1contributor”

↓ Version française ci-dessous ↓
The latest 2.4.X release sets the path for two major requested features: real-time collaboration and one-click remote data importers.
Additionally, minor improvements and bugfixes have made the tool more stable and usable.
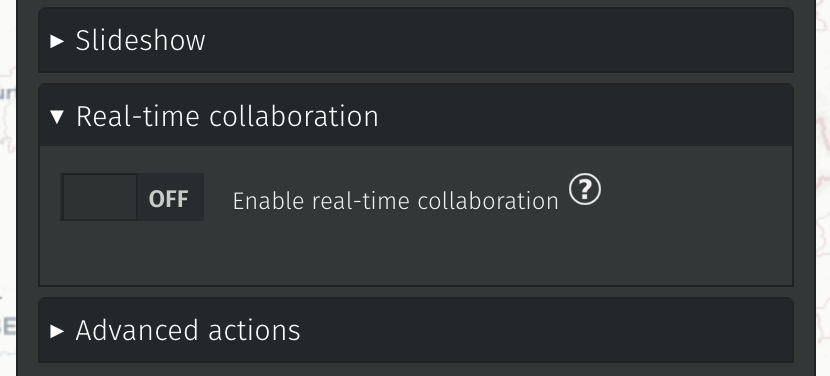
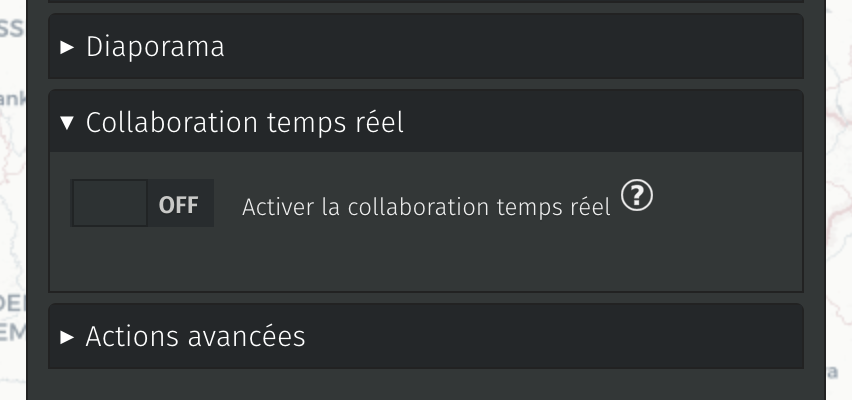
Real-time collaboration
Thanks to our NLnet sponsorship, we have been able to make the first push in that direction. This is not yet activated in any (known) instance but the underlying code is deployed and we will be able to manage allocated resources and fine-tune how websockets are deployed. Details of the next steps are available on Alexis’ blog post.
Given the required server changes for that new feature, it will be part of a future 3.X version when the dust has settled.
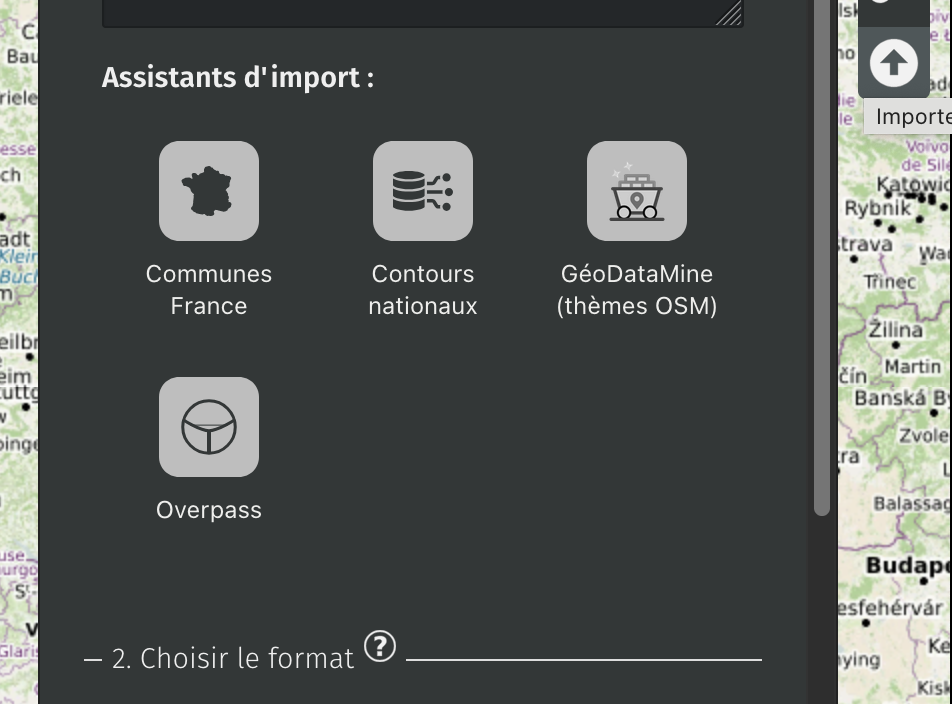
Remote data importers
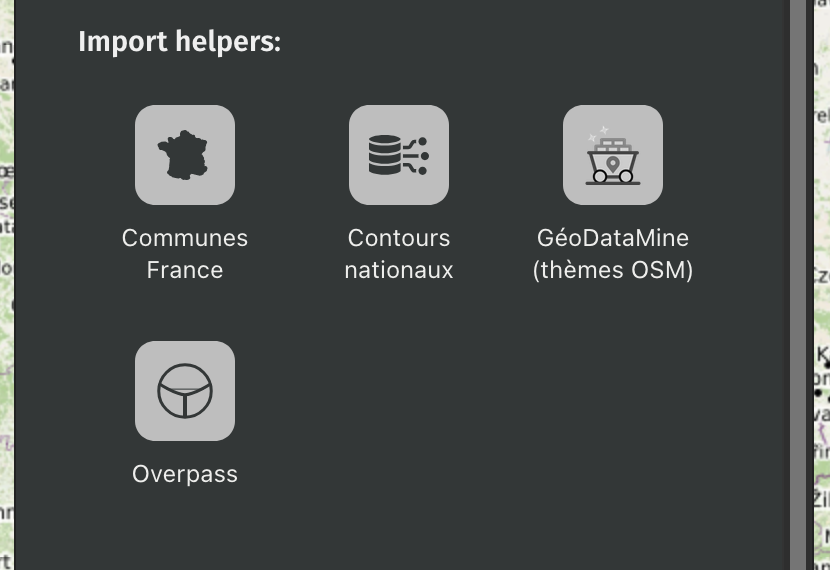
We made 4 importers to begin with:
- Datasets (generic): for the moment, it allows to import French régions and départements from the France Geojson project;
- GeoDataMine: thematic data from OpenStreetMap;
- Overpass: use Overpass queries directly within uMap thanks to the Overpass API;
- Communes: allows to retrieve borders for given French cities thanks to the GéoAPI.
Instances can choose which importers to activate or not (none by default) and of course develop and publish their own custom importers!
We hope this feature will help filling basics more conveniently.
There is more!
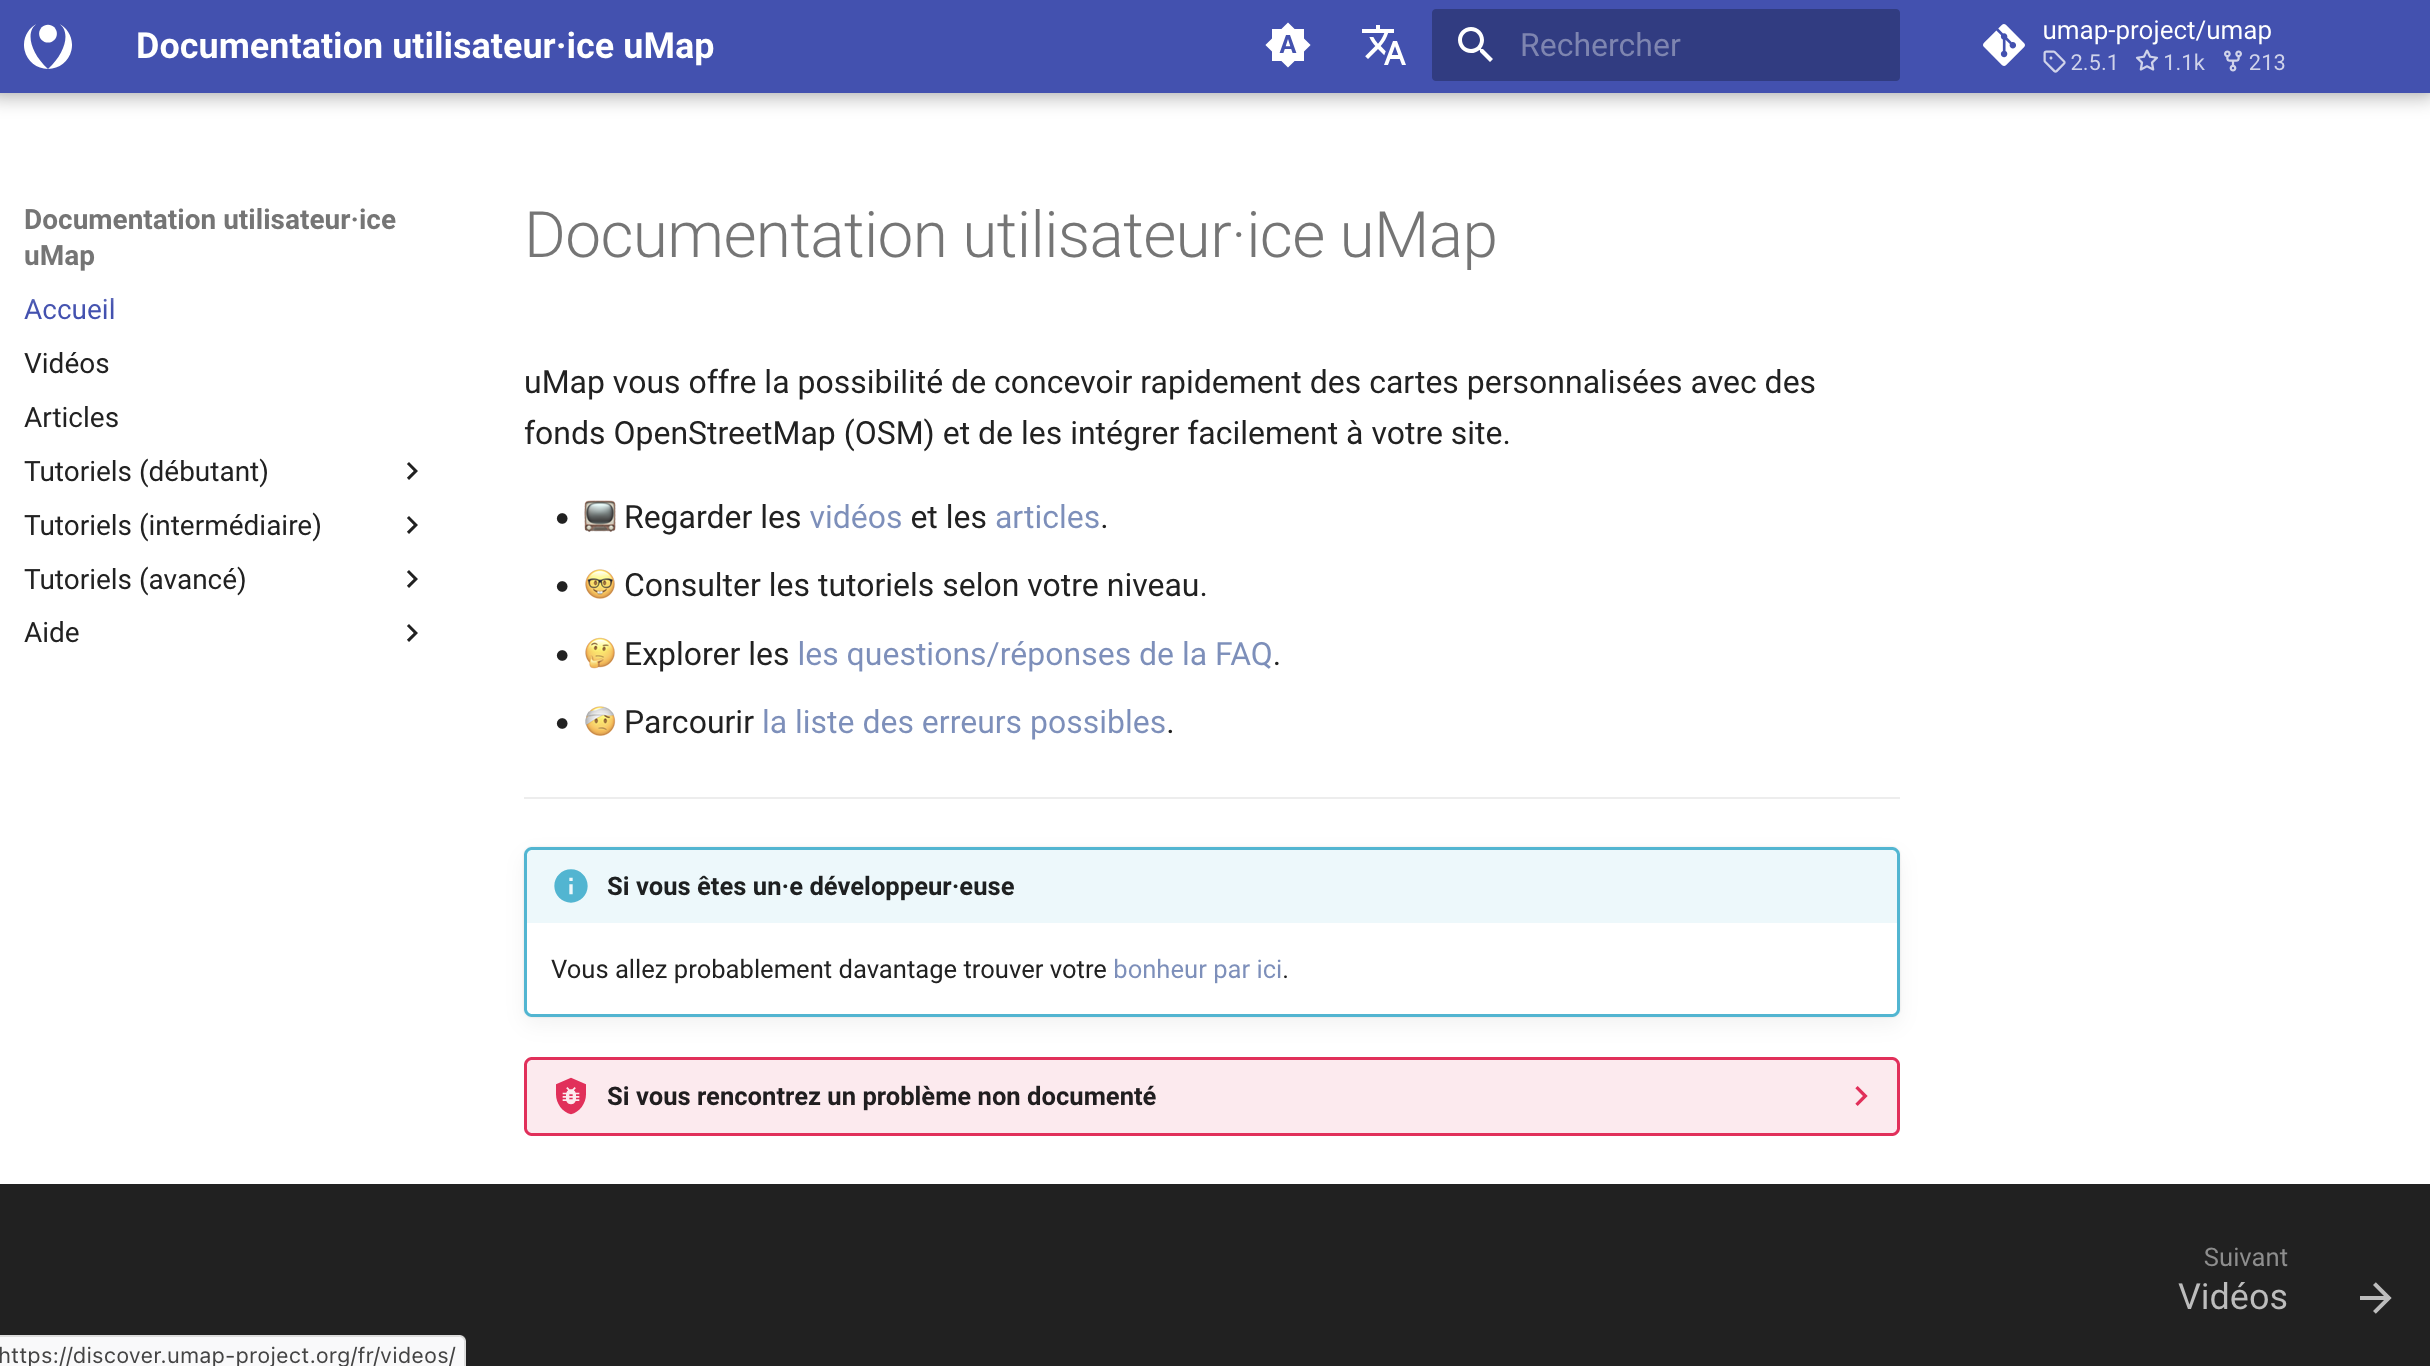
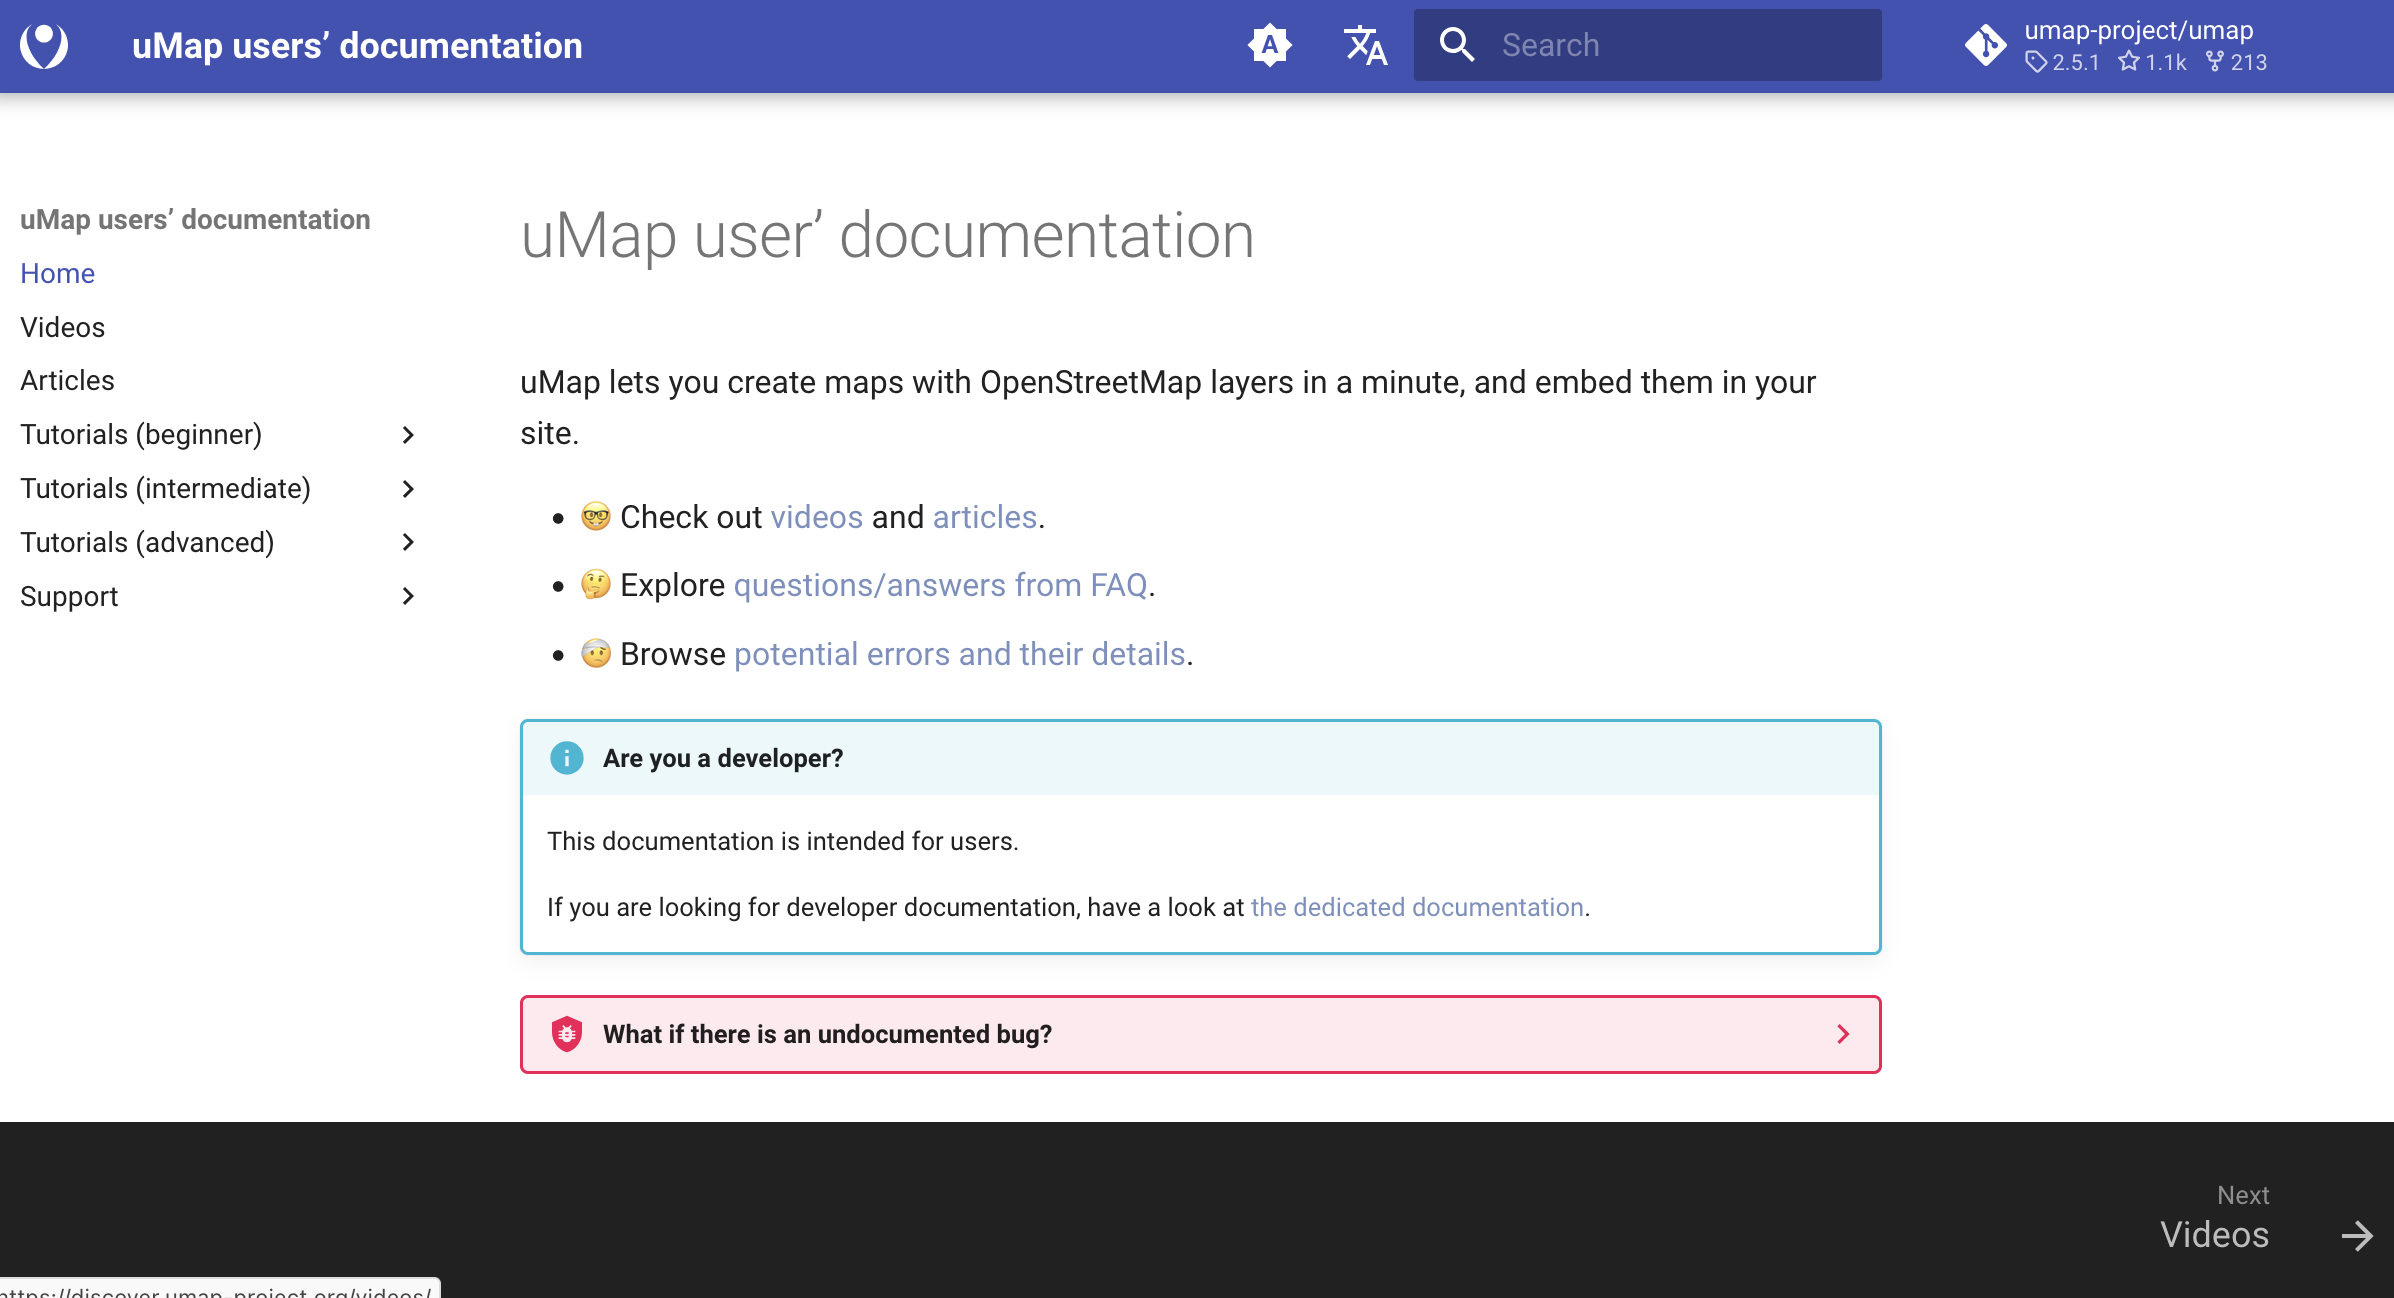
- A new users’ dedicated documentation website both in English and French for now — available at discover.umap-project.org — is up & improving! Go check it out and do not hesitate to contribute.
- Overall refactor of left/right panels with facets (including dates and numbers) and filters capabilities. ⚠️ It might affect your embeded maps, please verify your current map center is still pertinent.
- It is now possible to use conditional rules (syntax here) to style items given their data.
- Alert messages have been refactored, let us know if there is any issue displaying these!
- Editing data in OSM is a right-click away, bi-directional improvements, yay!
- Possibility to embed maps using the oEmbed standard.
Until next time! 👋
Vers uMap 3 😱
La dernière version 2.4.X ouvre la voie à deux fonctionnalités majeures demandées : la collaboration en temps réel et les assistants d’import de données à distance en un clic.
En outre, des améliorations mineures et des corrections de bogues ont rendu l’outil plus stable et plus utilisable.
Collaboration en temps réel
Grâce au parrainage de NLnet, nous avons pu faire un premier pas dans cette direction. Ce n’est pas encore activé dans une instance (connue), mais le code sous-jacent est déployé et cela nous permettra de progressivement gérer les ressources allouées et d’affiner la façon dont les websockets sont déployés. Les détails des prochaines étapes sont disponibles sur le blog d’Alexis.
Étant donné les changements nécessaires au niveau du serveur pour cette nouvelle fonctionnalité, elle fera partie d’une future version 3.X lorsque la peinture aura un peu séché.
Assistants d’import de données distantes
Nous avons créé 4 assistants d’import pour commencer :
- Datasets (générique) : pour l’instant, il permet d’importer les régions et départements français du projet France Geojson ;
- GeoDataMine : données thématiques provenant d’OpenStreetMap ;
- Overpass : permet d’utiliser les requêtes Overpass directement dans uMap grâce à l’API Overpass ;
- Communes : permet de récupérer les frontières de villes françaises données grâce à l’API Géo.
Les instances peuvent choisir quels assistants activer ou non (aucun ne l’est par défaut) et bien sûr développer et publier leurs propres assistants d’import personnalisés ! Nous espérons que cette fonctionnalité permettra de remplir les données de base plus facilement.
Et ce n’est pas tout !
- Un nouveau site de documentation dédié aux utilisateurs en français et en anglais pour l’instant - disponible sur discover.umap-project.org - est en place et s’améliore ! Allez le consulter et n’hésitez pas à y contribuer.
- Refonte globale des panneaux gauche/droite avec des facettes (y compris des dates et des nombres) et des capacités de filtrage. ⚠️ Cela pourrait affecter vos cartes intégrées, veuillez vérifier que votre centre de cartes actuel est toujours pertinent.
- Il est maintenant possible d’utiliser des règles conditionnelles (syntaxe ici) pour styler des éléments en fonction de leurs données.
- Les messages d’alerte ont été remaniés, faites-nous savoir si vous avez des problèmes pour les afficher !
- L’édition des données dans OSM se fait d’un clic droit, améliorations bidirectionnelles, hourra !
- Possibilité d’intégrer des cartes en utilisant le standard oEmbed.