
Power infrastructure, climate change and OpenStreetMap
Posted by InfosReseaux on 19 January 2025 in English. Last updated on 27 January 2025.OpenStreetMap is now 20 years old. Its community is contributing to complete a geographical database which fuel many activities, for instance useful for energy transition and power grids asset management. The increasing impacts of extreme weather phenomenons like storms or wild fires disrupt power grids and expose them to wider outages. Operators have to reinforce and adapt their assets for those upcoming challenges.
Overhead power grids asset management had suffered from disinterest since early 1990s for instance in France. It remains at least a significant challenge in developed countries. Important decisions that had been made to bury them and more generally because they are “highly visible infrastructure” don’t bring value to accurate knowledge about existing infrastructures. Nevertheless, several decades are required to completely hide a very capillary distribution grid. So we need to better describe them for sake of maintaining remaining overhead power grids, particularly ones that couldn’t be buried. In particular, very high voltage transmission lines will remain mainly overhead.
Producing and maintaining knowledge about utility networks assets is tedious and expensive without appropriate tools. I already had opportunity to explain how the “OpenStreetMap way” is helping for power transmission grid knowledge, back in 2020. Operators now face other challenges and are busy with bigger investments for transitions. Yet lesser time left for knowledge management as projects pace accelerate. Power grids inventory started early after OpenStreetMap birth in 2004. It began with most visible transmission grids. Tagging improvements are continuously made since 2010 and 15 years later we reach another step with a deeper experience in such activities.
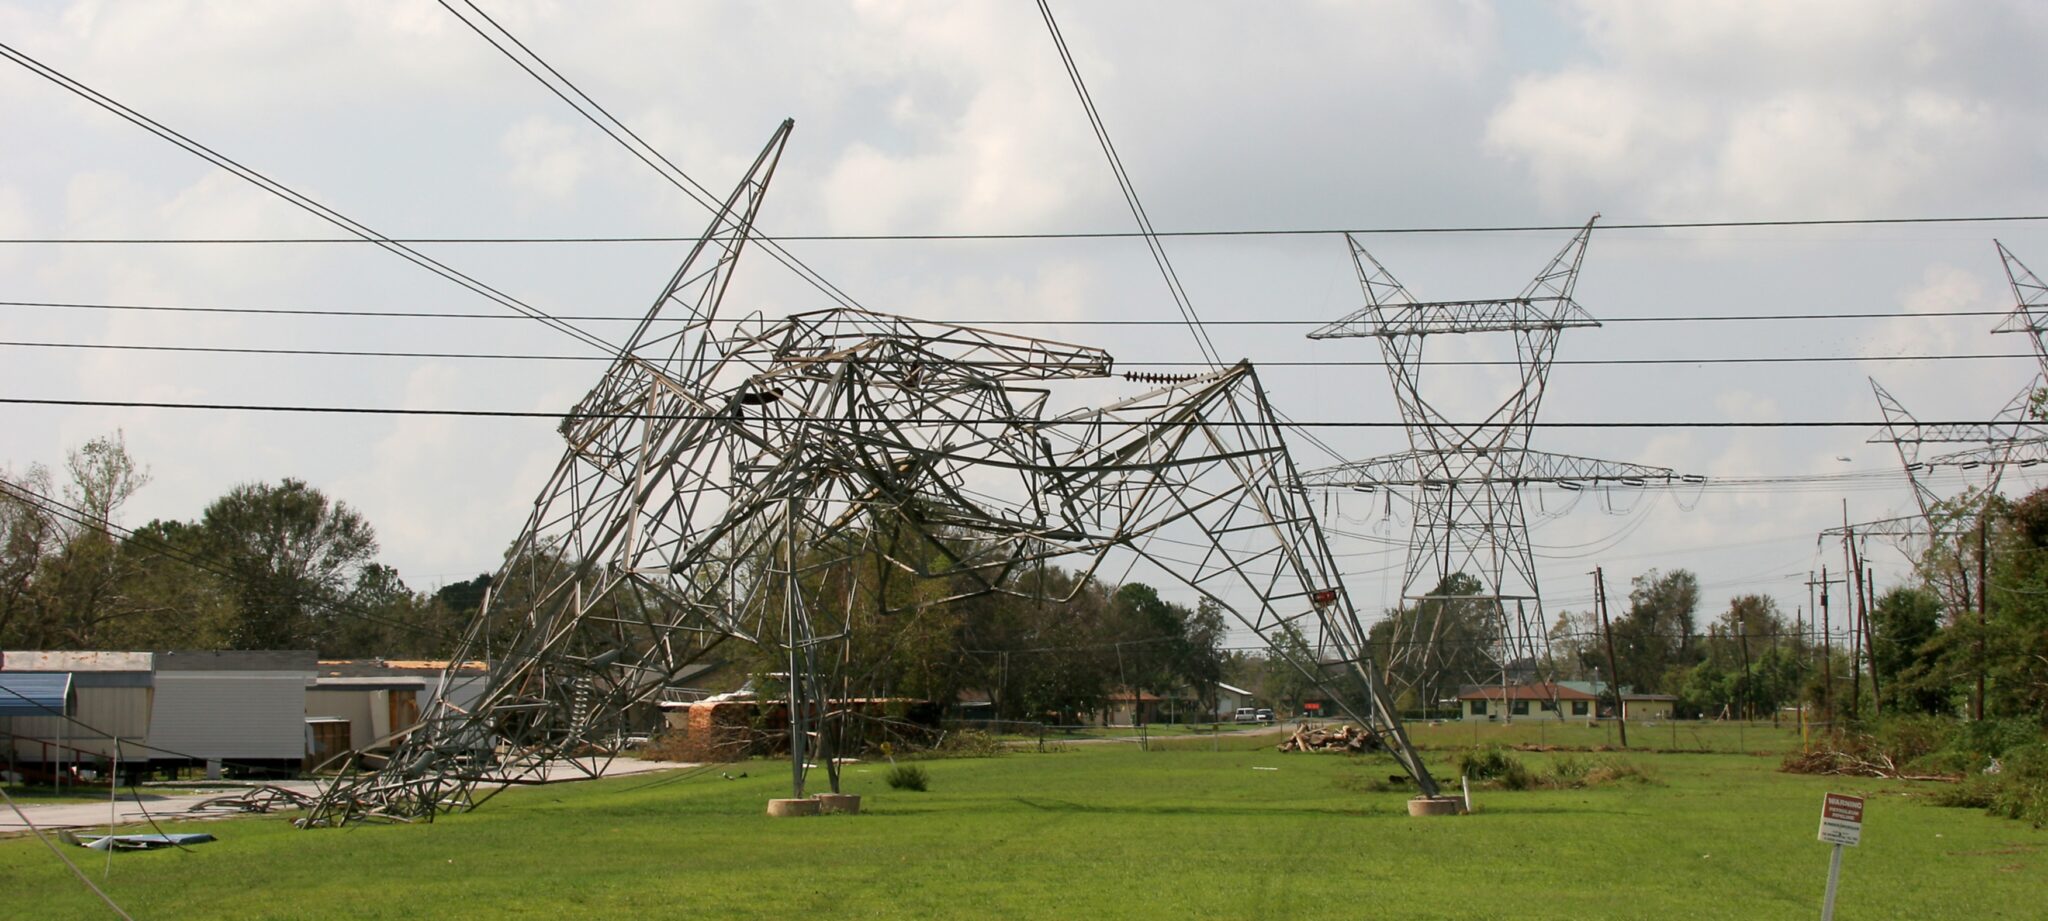 Rita storm damages in Texas, 2005 - Bob McMillan / FEMA Photo
Power grids adaptation to climate change
Climate change raises new challenges and force us to adapt our lifestyle and infrastructures. Disasters occurs more often and requires more accurate risk exposition studies to preserve resilience at an acceptable level.
In western Europe, Lothar and Martin storms at the end of 1999 had reminded us the power grids vulnerability to windy or snowy weather. French transmission grid operator (TSO), RTE, published an interesting retrospective of outages following those two storms. More recently in France, Ciaran (2023, 1.2 milions of subscribers off grid) and Caetano storms (2024, 600 000 subscribers off grid) had significantly damaged overhead distribution grids on shores. Enedis, the main distribution grid operator (DSO) set up a strategy to restore and prepare infrastructures to similar events in the Future. It notably requires to manage a detailed knowledge to identify parts of networks that require to be improved the most.
Overhead power grids are vulnerable to storms or wildfires and they could cause them as well (see how Pacific Gas & Electricty lack of maintenance was involved in the Camp Fire disaster in 2018). Lastly, power distribution grid operation was also questioned at Pacific Palisade. OpenStreetMap allows highly detailed description of power lines with their supports. It should be possible to compare this knowledge with one maintained by operators to reach completeness more quickly (on both OpenStreetMap and Operators sides since both still misses some parts of it even today). Back in 2021, OpenStreetMap France concluded a strategic partnership with French DSO Enedis to collaborate on asset knowledge accessible to OSM contributors.
Power grids ontology and tooling
Producing a business-grade useful knowledge needs a readable and comprehensive ontology. It enables contributors to sustainably cope with transitions and challenges. Back in 2015, community was busy building a more detailed tagging for power grids and it still supports interoperability today, between many OpenStreetMap tools and with operators or business focused ones as well. OpenStreetMap was already able to map visible parts of power grids and particularly got focused on power supports (towers and poles mainly). OSM tagging that covers towers and poles today relies on three main attributes. They’ve been reviewed in three proposals:
- line_attachment (2019, 23 pros) describes the way power lines are attached to their supports
- line_management (2020, 20 pros) describes particular topology situations around power lines supports
- line_arrangement (2023, 11 pros et 2 cons) describes the shape of conductors in a given power line
Learn more in this other diary published in 2020.
Open source software
Our tools are also a game changer to encourage people to contribute and value data they produce.
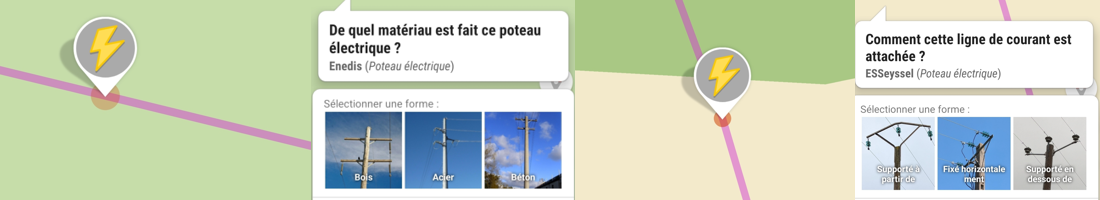
StreetComplete has got two additional quests. They regard the material of power poles and the attachment of power lines on them. Those quests ease the contribution from ground since those properties are poorly visible on aerial imagery.
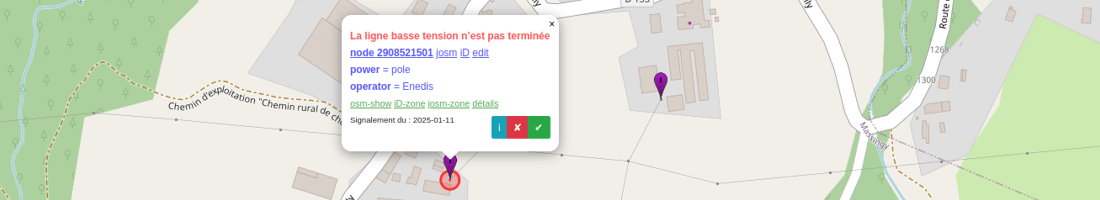
Secondly, we make a great use of quality insurance tools to maintain an acceptable quality level and not get lost in years-lasting refinements. For instance, several Osmose analysis search and warn for inconsistent or missing features and are based upon publicly available datasets in as many countries as possible.
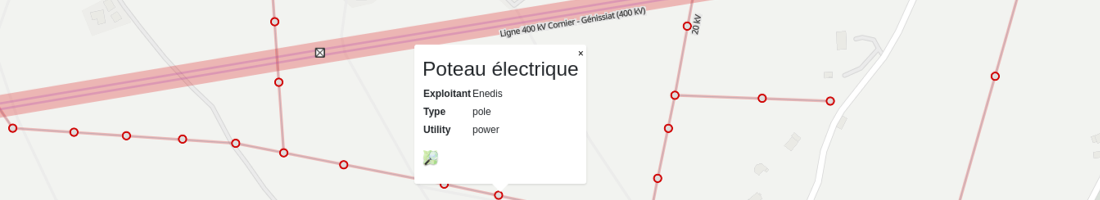
Gespot.fr has been online since september 2020. It acts as a demonstrator of what OpenStreetMap data make possible about overhead power grids asset management. Available data about towers and pole in France in OSM are directly rendered on the website’s map.
Software and ontology represent an original way of collecting and processing asset management data for power grids. They are available under licenses that preserve interests of both contributors and consumers. The journey to improve and innovate is not over and it’s still possible to contribute in one of several projects we had in this field of knowledge.
Open data and asset management
OpenStreetMap community knows how to produce knowledge virtuously by reusing available open data. We aim to enable people involved to give feedback to operators with their own ground surveys. It’s first of all static topology data and it doesn’t intend to describe the status of a network at a given date. Contributors on 5 continents now use the tagging used for power supports. This show a fast adoption rate, replacing historical properties that had to be refined.
In the beginning of 2025, the 3 main attributes of power towers or pole show 450 000 usages (line_attachment 309 000, line_management 124 000 and line_arrangement 17 000) although millions of power supports remain to be discovered.
It was necessary to inspect existing objects to move tagging to the new one and then to continue to collect efficiently data on ground about new features. Several campaigns occur in parallel, both on distribution and transmission grids, started on the initiative of contributors. This ongoing refinement provides consumers with data of ever-increasing consistency and completeness. It has been noticed by some researchers and software modelers for power grids. They make an increasing usage of OpenStreetMap data to feed their software with topological knowledge of power grids.
Focus on France
French community had recently been busy with transmission power grid. We aim to improve knowledge about power towers and implement tagging explained upside. At least one contributor review each of 255 000 towers supporting the overhead transmission power lines, since 2017. Some locations have been refined and some attributes have been added.
Particularly about the 30 000 of towers supporting the highest voltage power grid, towers designs shapes have been surveyed on ground or from aerial imagery since mid-2023 (absent from open data) and described with help of design:ref key. This initiative could be extended to lower voltage transmission grids with the help of AI and Lidar data that accurately show most of towers.
We are now able to render some summary and looking forward to get feedback from grid operator to know where our mistakes are:
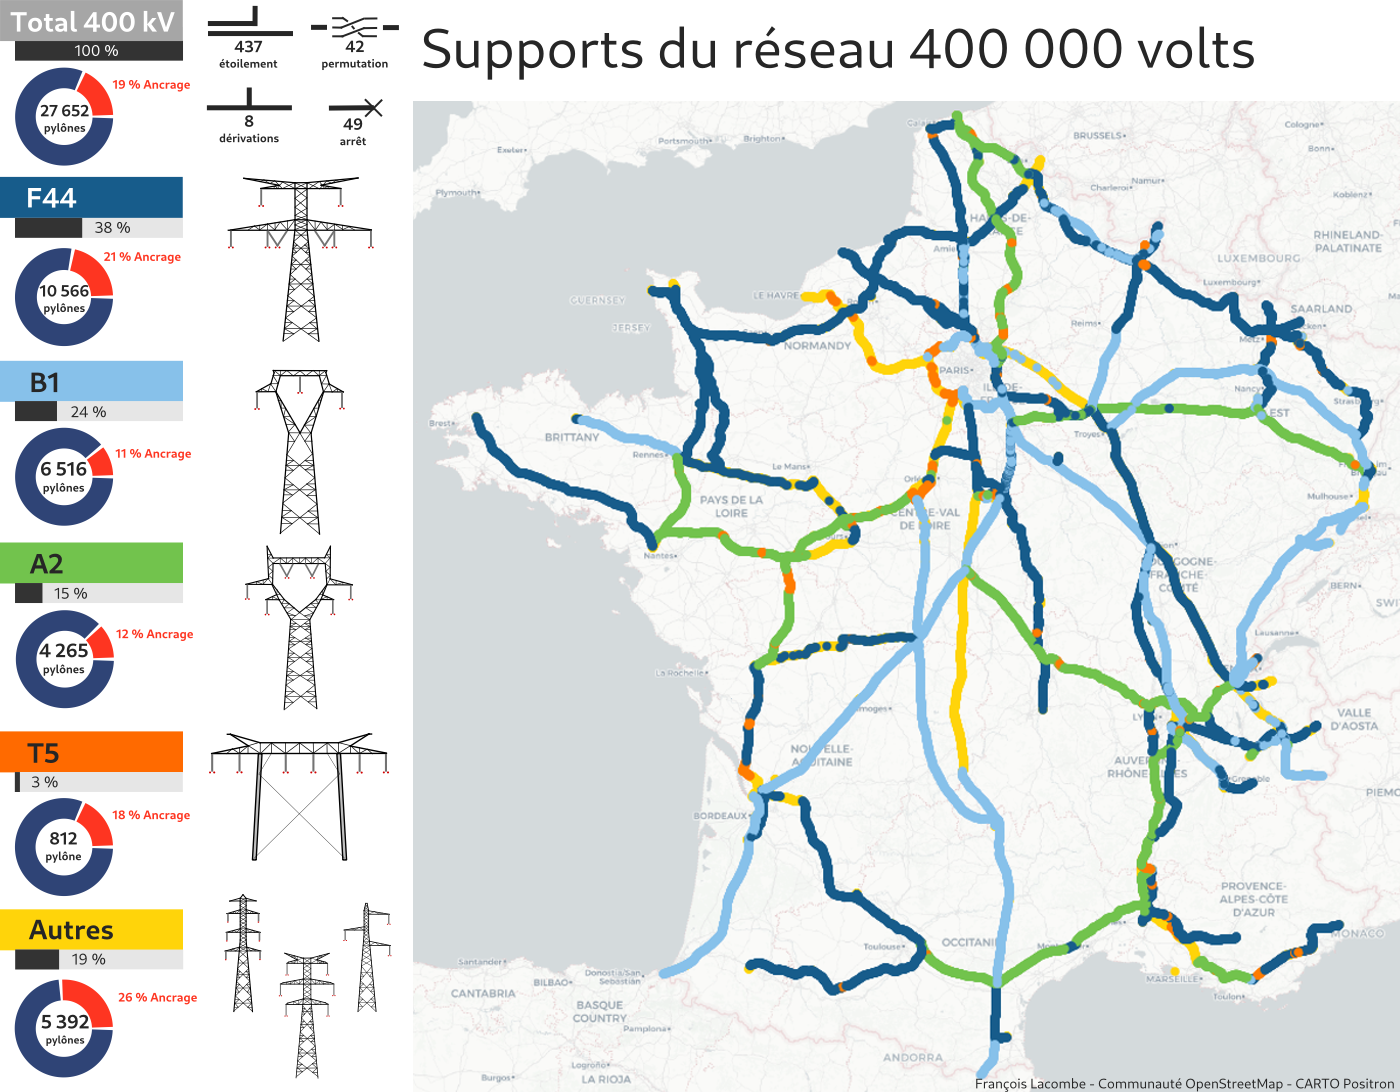 French 400 kV power towers summary - François Lacombe CC BY-SA 4.0
Distribution grids also got attention from the local community as we reached the symbolic step of 1.5 millions poles supporting lower voltage lines. More than 2 000 people has been involved since 4 years. The public platform running Projetdumois.fr is useful to understand how tremendous this effort is.
Perspectives
As we regularly get results from a long-term work started many years ago, we show that OpenStreetMap is relevant to produce very specific knowledge, particularly about overhead power grids. This knowledge is necessary to ongoing efforts to adapt our infrastructure to climate change and energy transition.
Good wills allowing to reach consistency and completeness goals anywhere in the world are always welcome. Produced data are available on standard OpenStreetMap access points under ODbL license. We see many industrial or scientific initiatives which require high quality data to operate but a very few take time to provide us with the knowledge they produced about the underlying infrastructure. This lack of sharing will possibly lessen our common efficiency to adapt and finally tackle this century challenge.
Here are some ideas if you want to get involved to help:
- Developers, have a look to Osmose power issues, JOSM power issues or even iD power tagging to help us solve them
- Contributors, have a look to local power projects. Some may match the country you are located in.
- Consumers, give a try to OpenStreetMap data in your area and provide us with feedback on what improvements could be made.
- Operators, also give a try to OpenStreetMap data as to compare with internal data and find useful feedback
This diary has been translated from French, original publication is available on OpenStreetMap France website.
Discussion
Comment from Pieter Vander Vennet on 26 January 2025 at 15:59
Very interesting!
A few remarks and questions:
Comment from InfosReseaux on 27 January 2025 at 12:10
Hello Thank you for your extensive reading! I’ve fixed the typos.
The security criticism is often inappropriate. People arguing such data shouldn’t be available didn’t properly observed that we are dealing with visible features, mainly. Making such knowledge offline will only cause harm to legit usages, that should deal with much constraints than offenders (license, data standards, quality control…). Security by obscurity doesn’t even exist and we won’t be better prepared to any crisis by refraining from producing data or document our infrastructure. Security is an important topic and we should discuss seriously about it. I bet mastering osm data could also help law enforcement and authorities to investigate more efficiently.
It’s true MapComplete could be a good tool to improve very broad infrastructure inventory. I’ll have a look at it on how we could add similar quests about power poles